Figures & data
Figure 1. Plasma torch and selective killing effects. (A) The plasma torch directly treating cells in culture on an inverted microscope. (B) A scanned image of the markings that were stamped on the cell culture plate to assay the target site (a), adjacent site (b), and distal site (c). (C) The two torches utilized in these experiments (a) and and (b) . (D) Images of 1205Lu melanoma cells following stable transfection and cell sorting. We measured 100% transfection efficiency, a) phase contrast and b) fluorescence microscopy. (E) Co-cultures of 1205Lu melanoma cells expressing GFP and keratinocytes seeded at a 1:25 ratio. Propidium iodide (stains dead cells in red) and Hoechst 33342 (labels DNA in cell nuclei blue) were added just prior to treatment. The GFP-expressing melanoma cell is shown within the red circle and demarcated with a white arrow (enlarged in box inset). The images were taken at time points indicated a) untreated, b) after 1 min post plasma treatment, and c) after 5 min post-plasma treatment. These experiments were repeated several times with consistent results.
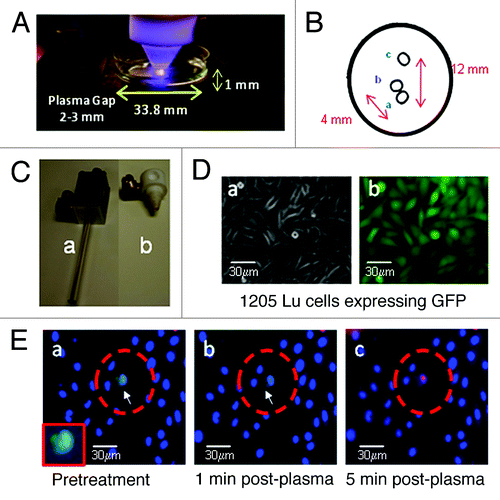
Figure 2. A comparison of the cytotoxic effects of NTP on premetastatic and metastatic melanoma under stable pH conditions. (A)WM793B and 1205Lu cells expressing the GFP vector were subjected to treatment with NTP for 10 sec and a time course in cell death was followed up to 17 min at the target site [p = 0.0006 (1.5 min), 0.0340 (7 min), 0.0920 (17 min) ]. (B) The pH remained constant at 7.3 during the time course following NTP in 2A and in subsequent experiments.
![Figure 2. A comparison of the cytotoxic effects of NTP on premetastatic and metastatic melanoma under stable pH conditions. (A)WM793B and 1205Lu cells expressing the GFP vector were subjected to treatment with NTP for 10 sec and a time course in cell death was followed up to 17 min at the target site [p = 0.0006 (1.5 min), 0.0340 (7 min), 0.0920 (17 min) ]. (B) The pH remained constant at 7.3 during the time course following NTP in 2A and in subsequent experiments.](/cms/asset/a367b510-659c-4fff-bc53-3582b2119501/kcbt_a_10921787_f0002.gif)
Figure 3. Plasma induced cell surface membrane blebbing and apoptosis. (A) 1205Lu cell untreated (a) or 15 min after 10s plasma treatment (b), where membrane surface blebbing is readily observed (red arrows). (B) Untreated (a) and plasma treated (c) melanoma cells along with untreated (b) and treated (d) keratinocytes were stained with the TUNEL assay 18 h after plasma treatment to identify fragmented DNA diagnostic for apoptotic cells. Background non-specific red nucleolar staining was observed in keratinocytes. (C) Percent apoptotic cells in melanoma vs. HEK cells. Results are plotted for a representative experiment counting triplicate samples with > 150 cells per cell line (p = 0.00076).
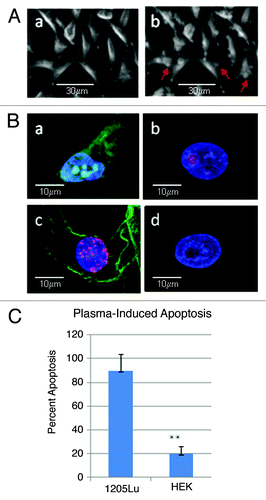
Figure 6. The area of cell death can be increased, through the passage of signals between gap junctions. Comparison of the cell death by NTP in WM793B cells expressing either a wild type or dominant negative Cx43 (T154A). p = 0.0058.
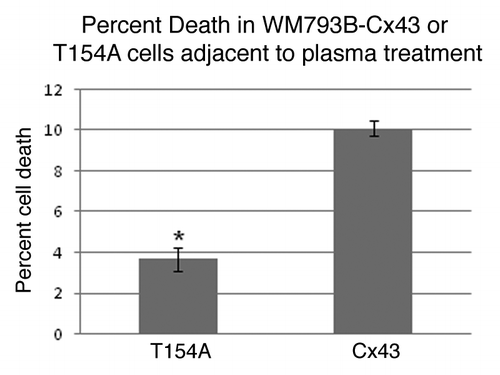
Table 1. Summary of comparative cell death of melanoma cells and HEK by NTP
Figure 4. Cell death following plasma treatment. (A) Identical phase contrast microscope fields for (a) untreated and (c) 10s plasma treated keratinocytes and (b) untreated and (d) 10 sec plasma treated melanoma cells after 24h. The demarcation between treated and untreated cells is shown as a white line in (e). (B) These results are from a representative experiment with duplicate plates averaging 500–700 cells per plate prior to plasma treatment, (10 sec p = 0.0054)*, (30 sec p = 6 x 10⁻⁶)**
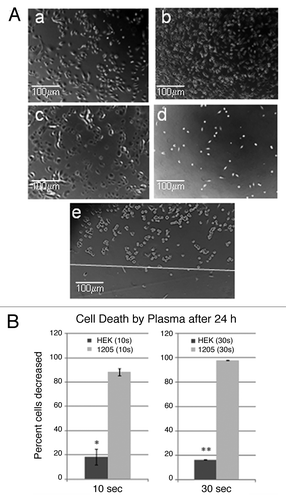
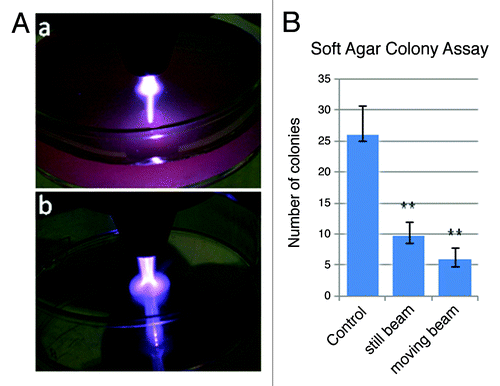
Figure 5. NTP-induced melanoma cell death within a soft agar matrix. (A) Images of the plasma torch making contact with either (a) the surface of cell culture media (4 ml Epilife media in a 35 mm culture dish) or (b) on the surface of an empty culture dish. Both images were taken under identical torch conditions (Frequency: 97 kHz, Flow rate: 6.0 L/min). (B) Soft agar colony forming assay to compare the number of colonies in control, untreated wells to wells treated with a motionless beam for 30 sec as well as a beam that was moved in concentric circles for 30 sec. The results are from a representative experiment and were repeated under the same plasma conditions (Flow rate of 5.8 L/min) as well as at higher flow rates up to 11 L/min with similar results. The student’s T test shows high significance between the control and the still (p = 4.6 x 10⁻⁸) or moving beam (p = 1.4 x 10⁻⁹) conditions as well as significance between the still vs. moving conditions (p = 0.00135).