Figures & data
Figure 2. Particle size and scanning electron microscope (SEM) image of GC/5-FU. (A) Particle size graph showing the diameter of GC/5-FU (35.19 ± 9.50 nm). (B) SEM image of GC/5-FU. The particles show spherical structure with a smooth surface and no adhesion between nanoparticles.
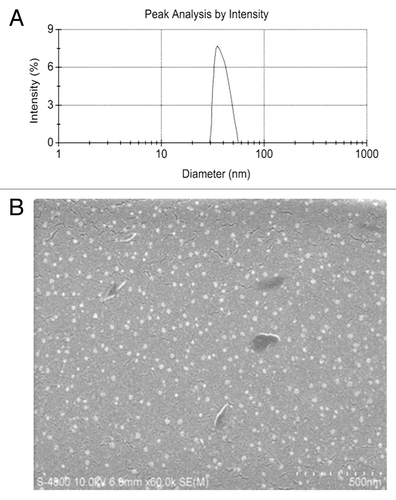
Figure 3. The in vitro release curve of nanoparticles in simulated body fluid (37°C, pH 7.4, n = 3). A rapid release was observed from time 0 to 12 h, with a cumulative release percentage of 32.4%; a smooth slow-release occurred between days 1 and 8, with a cumulative release percentage of 93.50%. During days 8 to 10, the release reached a plateau, with a cumulative release percentage of 95.70% at day 10.
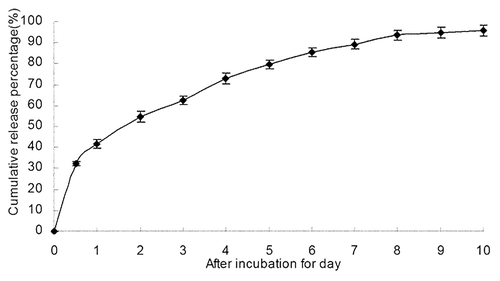
Figure 4. Concentration-time curves of 5-FU and GC/5-FU from 5 min to 48 h in mice after tail vein injection (n = 150). The Cmax of 5-FU group appeared within 5 min, and then the concentration stepped down quickly. The concentration was near 0 after 4–6 h. The concentration of GC/5-FU was slowly increased and reached to the Cmax of it about 2 h, then the concentration stepped down slowly and maintained within 30–60 h. GC/5-FU group’s Cmax of 5-FU in plasma were lower than the 5-FU group, but the half-life time was obviously longer than that of 5-FU group.
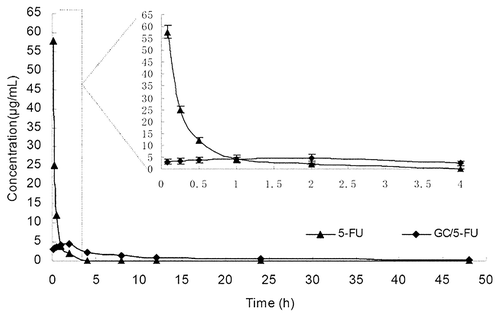
Table1 Pharmacokinetic parameters of 5-FU and GC/5-FU
Figure 5. Model mice and normal mice were treated with i.v. 5-FU or GC/5-FU, 5-FU concentration in different tissues was determined 30 min post-injection; results were shown as an average ± standard deviation (n = 5). (A) 5-FU concentration in different tissues in normal mice. The 5-FU concentration in the liver in GC/5-FU group was significantly higher (over 1.5-fold) than that in 5-FU group. (B) 5-FU concentration in different tissues in model normal mice. The 5-FU concentration of liver and liver cancer tissue in GC/5-FU group was increased significantly than that in 5-FU group, the 5-FU concentration of liver cancer tissue in GC/5-FU group was over 2-fold in 5-FU group.
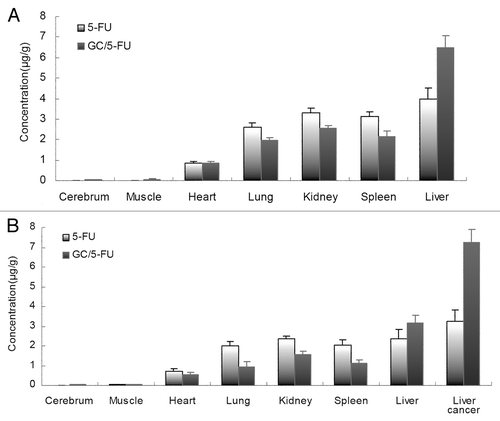
Figure 6. The curative effect of GC/5-FU on liver cancer in the orthotopic transplant model of hepatocellular carcinoma. (A) 5 d after the tumor was established, GC/5-FU, 5-FU, GC or PBS was given to the mice. Tumor weight was measured at day 10. (B)Treatment was given as described previously and the survival was monitored. The median survival for control, GC, 5-FU and GC/5-FU groups were 12, 13, 17 and 30 d, respectively. Compared with control or GC group, **p < 0.01; compared with 5-FU group, ##p < 0.01.
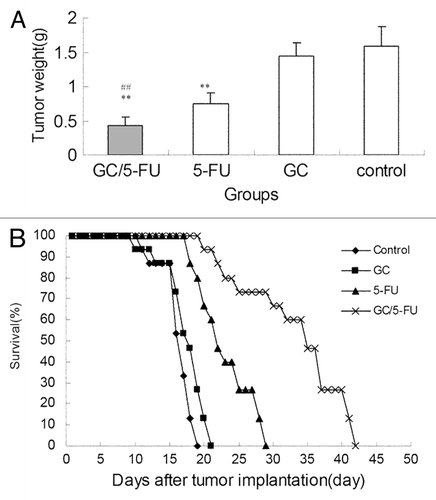
Figure 7. The effects of different treatments on cell cycle, proliferation index and apoptosis index. (A) Flow cytometry analysis of cell cycle distribution of H22 cells. (B) Quantification of cell cycle distribution and proliferation index of H22 cells. Percentage of cells in G0-G1 in the GC/5-FU and 5-FU groups was higher than that in control and GC groups, while the proliferation index decreased significantly (p < 0.01). (C) Quantification of apoptosis of H22 in different treatment groups. Compared with control or GC group, **p < 0.01; compared with 5-FU group, ##p < 0.01.
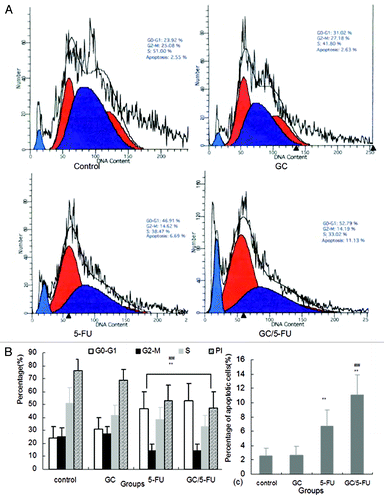
Figure 8. in situ apoptosis detected by TUNEL assay. Few apoptotic cells can be detected in control or GC groups; scattered distributed apoptotic cells can be observed in the 5-FU-treated group and massive clustered apoptotic cells were seen in the GC/5-FU group.
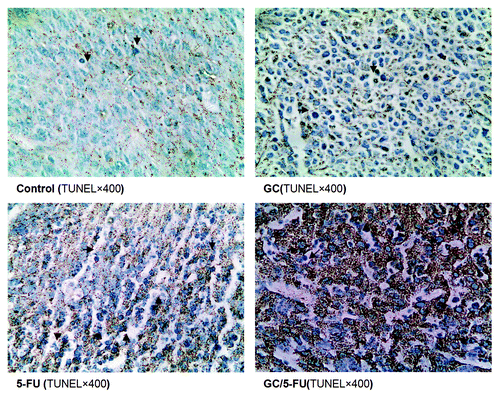
Figure 9. Bar graph showing quantification of the apoptotic index (AI) in hepatic cancer tissues with different treatments. AI increased from control to GC to 5-FU to GC/5-FU (p < 0.01). Compared with control or GC group, **p < 0.01; compared with 5-FU group, #p < 0.05.
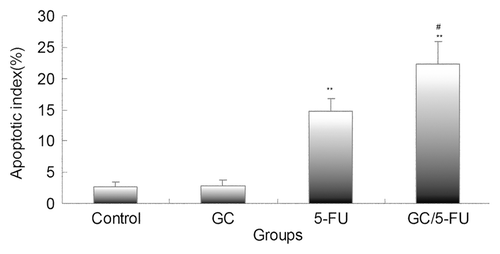
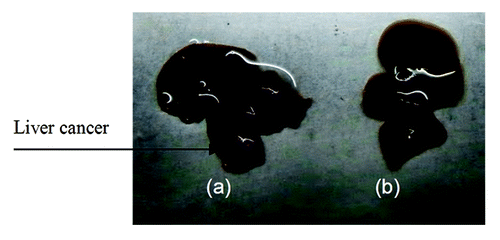
Figure 1. Establishment of the hepatic cancer mouse model. (A) Liver cancer; (B) normal mouse liver.