Figures & data
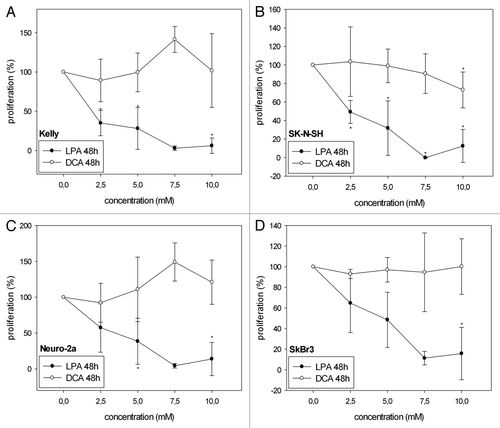
Figure 1A–D. Cell viability/proliferation of Kelly (A, E), SK-N-SH (B, F), Neuro-2a (C, G) and SkBr3 (D, H) cells 24 h and 48 h after treatment with different concentrations of LPA or DCA (WST-1 cell proliferation assay). Controls were set to 100%. Values below 100% indicate decreased and values above 100% increased cell viability/proliferation. Treatment with LPA resulted in decreased cell viability/proliferation both at 24h and 48h. In contrast, DCA did not significantly decrease cell viability/proliferation. Moreover, DCA treatment with and 7.5 mM and 10 mM resulted in increased cell viability/proliferation in Neuro-2a cells at 48h (G). Similarly, treatment of Kelly cells with 7.5 mM DCA resulted in increased cell viability/proliferation at both 24h and 48h (A, E). * indicates p < 0.0125 compared with the untreated controls (after Bonferroni adjustment). Means ± standard deviations (n = 3).
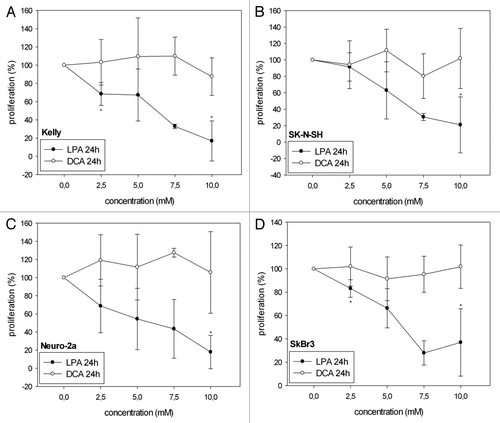
Figure 2. Cell Index (electrical impedance) of different cell lines after treatment with LPA. Kelly (A), SK-N-SH (B), Neuro-2a (C) and SkBr3 (D) cells were treated with different concentrations of LPA (0.5 mM, 1 mM, 5 mM). Electrical impedance of cells expressed as Cell Index, indicative of cell viability, was measured continuously over 80 h using the xCELLigence system. Arrows indicate time-points of LPA addition.
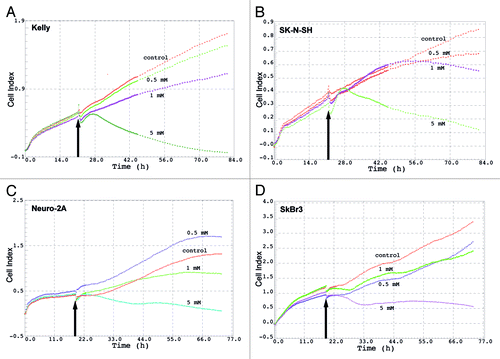
Figure 3. Effects of different concentrations of LPA and DCA on [18F]-FDG uptake (CPM/μg protein) of Kelly (A), SK-N-SH (B), SkBr3 (C) and Neuro-2a (D) cells. Controls were set to 100%. Treatment with LPA significantly reduced [18F]-FDG uptake in a concentration dependent manner. In contrast, DCA did not affect glucose uptake at concentrations up to 10 mM. * indicates p < 0.01 compared with the untreated controls (after Bonferroni adjustment). Means ± standard deviations (n = 3).
![Figure 3. Effects of different concentrations of LPA and DCA on [18F]-FDG uptake (CPM/μg protein) of Kelly (A), SK-N-SH (B), SkBr3 (C) and Neuro-2a (D) cells. Controls were set to 100%. Treatment with LPA significantly reduced [18F]-FDG uptake in a concentration dependent manner. In contrast, DCA did not affect glucose uptake at concentrations up to 10 mM. * indicates p < 0.01 compared with the untreated controls (after Bonferroni adjustment). Means ± standard deviations (n = 3).](/cms/asset/973bc4d3-bd9d-4de7-a748-b7417395c90e/kcbt_a_10922003_f0004.gif)
Figure 4. L-lactate production (mM) in Kelly (A), SK-N-SH (B), SkBr3 (C) and Neuro-2a (D) cells at 0, 2, 24, 48 and 72 h after initiation of treatment with different concentrations of LPA. Time-dependent increase in lactate concentrations as observed in untreated controls was reduced subject to the applied LPA concentrations. Means ± standard deviations (n = 3).
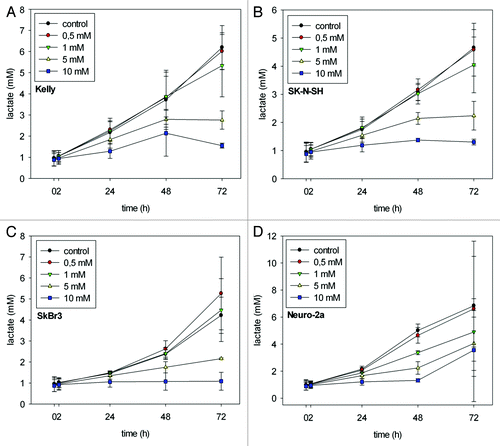
Figure 5. Detection of apoptosis subject to the LPA concentration applied by quantification of active caspase-3 in Kelly (A), SK-N-SH (B), SkBr3 (C) and Neuro-2a (D) cells 24 h after initiation of treatment. The graphs show an increase of active caspase-3 with increasing LPA concentrations in all cell lines analyzed. Activity of caspase-3 after treatment of cells with camptothecin (1 μg/ml) was used as a positive control, because camptothecin is known to induce apoptosis. Means ± standard deviations (n = 3).
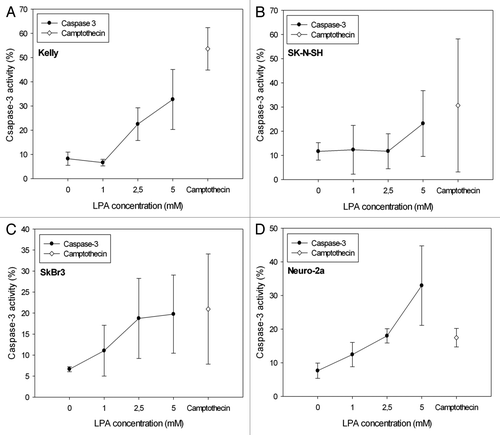
Figure 6. Monitoring of tumor growth at different time points after initiation of treatment with LPA. Seven days after s.c. inoculation of SkBr3 tumor cells animals were mock treated with PBS or injected daily with LPA (18.5 mg/kg) (n = 7 per group). Tumor volumes were measured biweekly with a sliding calliper beginning at day 1 after initiation of treatment (A) (means ± standard deviations). Additionally, tumor sizes and locations were monitored with [18F]FDG-PET at days 7, 14 and 28 both in mock-treated (B) and LPA treated mice (C). Tumors are marked by arrows. Treatment of animals with LPA significantly retarded tumor growth compared with mock-treated animals.
![Figure 6. Monitoring of tumor growth at different time points after initiation of treatment with LPA. Seven days after s.c. inoculation of SkBr3 tumor cells animals were mock treated with PBS or injected daily with LPA (18.5 mg/kg) (n = 7 per group). Tumor volumes were measured biweekly with a sliding calliper beginning at day 1 after initiation of treatment (A) (means ± standard deviations). Additionally, tumor sizes and locations were monitored with [18F]FDG-PET at days 7, 14 and 28 both in mock-treated (B) and LPA treated mice (C). Tumors are marked by arrows. Treatment of animals with LPA significantly retarded tumor growth compared with mock-treated animals.](/cms/asset/1d0997ed-4ce5-44e7-9936-a4ad75e5badf/kcbt_a_10922003_f0007.gif)
