Figures & data
Figure 1. p38α DFG-in co-crystal structure with SB203580 (PDB ID: 1A9U) (A); p38α with sorafenib (PDB ID: 3HEG) with missing activation loop (in proximity of the DFG motif) and the glycine rich loop reconstructed by homology modeling starting from PDB ID: 1W83 (B).
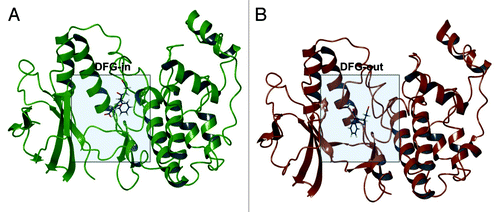
Figure 2. Logarithmically growing HT-29 (A) and HCT-116 (B) cells were cultured for 24h (A) or 48h (B) in the presence of Dmso, SB202190 (10 μM), increasing concentrations of sorafenib (5–40 μM) or a combination of sorafenib (10 μM) and SB202190 (10 μM) (A), or Dmso or a combination of sorafenib (10 μM) and SB202190 (10 μM) (B). Immunoblots were performed with the indicated antibodies.
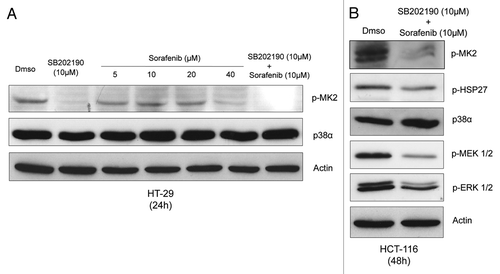
Figure 3. Logarithmically growing HCT-116 (A) and HT-29 (B) cells were cultured for 48h in the presence of Dmso, SB202190 (5–10 μM), sorafenib (5–20 μM) or a combination of SB202190 (5–10 μM) and sorafenib (5–20 μM). After 48 h, living cells were stained with Coomassie blue. Relative colony density is indicated for each time-point analyzed. Living cells were subjected to FACS analysis and the sub-G1 DNA content was measured by flow cytometry (C). Means from triplicates ± SD are shown.
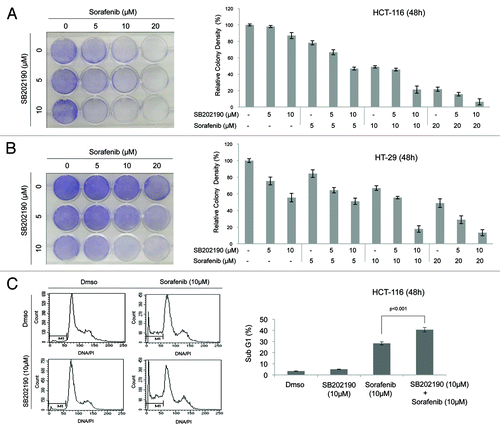
Figure 4. The indicated CRC cells were cultured for 48h in the presence of Dmso, SB202190 (10 μM), sorafenib (20 μM) or a combination of SB202190 (10 μM) and sorafenib (20 μM). Then, cells were harvested and subjected to immunoblot with the indicated antibodies (A, B, D, E, F), or living cells were stained with Coomassie blue (C). To inhibit caspase 8 activity, Z-IEDT FMK (10 μM) was added to the culture for the last 12h (F).
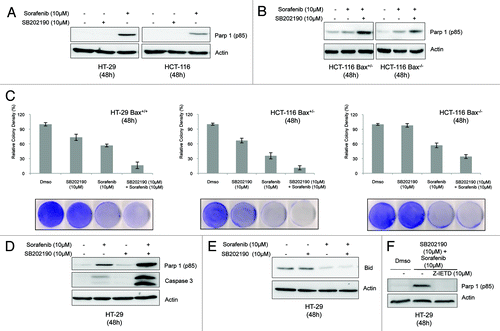
Figure 5. Growth kinetics of HCT-116-xenografted tumors (A). HCT-116 cells were injected subcutaneously into each flank of CD1 athimic nude mice. Mice were treated daily with SB202190 or sorafenib or a combination of both or the vehicle alone starting when tumors had reached a mean volume of 100 mm3. Animals were sacrificed when control tumors reached a mean volume of around 700 mm3. Representative tumors explanted from mice after the indicated treatments (B). Graph showing the volume of explanted tumors (mean ± SD) (C).
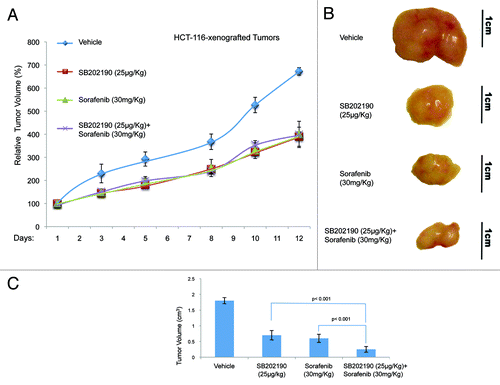
Figure 6. Growth kinetics of HT-29-xenografted tumors (A). HT-29 cells were injected subcutaneously into each flank CD1 athimic nude mice. Mice were treated daily with SB202190 or sorafenib or a combination of both or the vehicle alone starting when tumors had reached a mean volume of 100 mm3. Animals were sacrificed when control tumors reached a mean volume of around 550 mm3. Representative tumors explanted from mice after the indicated treatments (B). Graph showing the volume of explanted tumors (mean ± SD) (C).
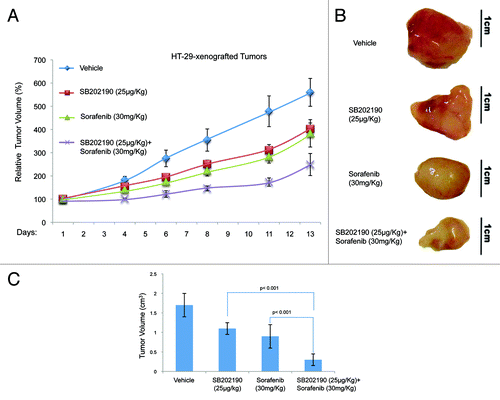
Figure 7. Hematoxylin and eosin (H&E) staining and immunohistochemical analysis of HCT-116-xenografted tumors with antibodies recognizing phosphorylated ERK (p-ERK) and MK2 (p-MK2). Apoptosis was scored by TUNEL assay.
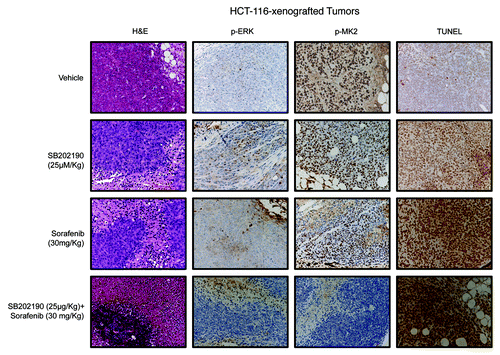
Figure 8. Hematoxylin and eosin (H&E) staining and immunohistochemical analysis of HT-29-xenografted tumors with antibodies recognizing phosphorylated ERK (p-ERK) and MK2 (p-MK2). Apoptosis was scored by TUNEL assay.
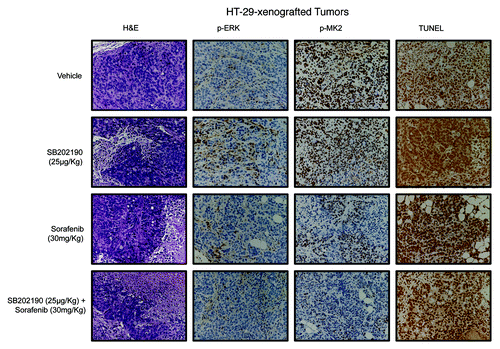
Table 1. Histological and immunohistochemical evaluation of HCT-116- and HT-29-driven colorectal tumors based on the data represented in , , and
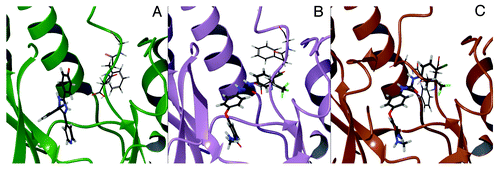
Figure 9. Binding mode of SB202190 to p38α in the DFG-in conformation (PDB ID: 1A9U) (A). Lowest energy binding mode of sorafenib to p38α in the DFG-in conformation after Induced Fit Docking (IFD) (B). Binding mode of sorafenib to p38α in the DFG-out conformation (PDB ID: 3HEG).