586
Views
5
CrossRef citations to date
0
Altmetric
Bedside to Bench Report

Toward personalized therapy for chronic lymphocytic leukemia

DSC and cDNA microarray assessment of two cases

, , , , , , , , , & show all
Pages 6-12 | Received 20 Apr 2012, Accepted 22 Oct 2012, Published online: 31 Oct 2012

Figures & data

Table 1. Clinical characteristics of patients

Figure 1. Viability of CLL cells (A), differential scanning calorimetry profiles of nuclear fraction (B) and changes in expression of apoptosis-related proteins (Mcl-1, Bcl-2, procaspase-3, Noxa) in PBMC lysates (C), isolated from blood of patients PZ and RJ, incubated for 48 h with and without RCM combination. Immunoblot analysis of PBMCs after their exposure to drug combination were analyzed by alkaline phosphatase method in the presence of appropriate antisera. Protein lysates (50 μg) were loaded into 12.5% polyacrylamide gels; β-actin was used as loading control; Cpex - excess heat capacity.
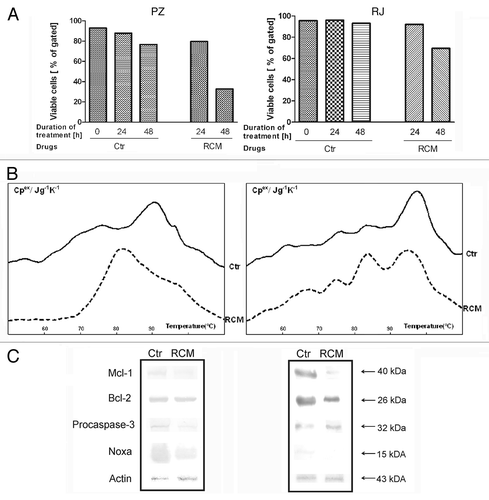
Figure 1. Viability of CLL cells (A), differential scanning calorimetry profiles of nuclear fraction (B) and changes in expression of apoptosis-related proteins (Mcl-1, Bcl-2, procaspase-3, Noxa) in PBMC lysates (C), isolated from blood of patients PZ and RJ, incubated for 48 h with and without RCM combination. Immunoblot analysis of PBMCs after their exposure to drug combination were analyzed by alkaline phosphatase method in the presence of appropriate antisera. Protein lysates (50 μg) were loaded into 12.5% polyacrylamide gels; β-actin was used as loading control; Cpex - excess heat capacity.

Figure 2. Microarray analysis indicating changes in expression of 89 apoptosis-related genes in two CLL samples following immunotherapy (top); boxplots of the DDCT values of samples from patients PZ and RJ (bottom). The rows and the columns represent individual genes and mRNA samples, respectively. The relative level of gene expression is depicted according to the color scale shown below the matrix. The accuracy of reading in the presented experiments is illustrated by boxplots of the signal (signal DDCT ~-logRQ).
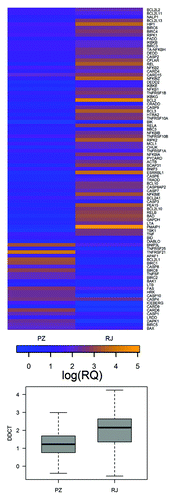
Figure 2. Microarray analysis indicating changes in expression of 89 apoptosis-related genes in two CLL samples following immunotherapy (top); boxplots of the DDCT values of samples from patients PZ and RJ (bottom). The rows and the columns represent individual genes and mRNA samples, respectively. The relative level of gene expression is depicted according to the color scale shown below the matrix. The accuracy of reading in the presented experiments is illustrated by boxplots of the signal (signal DDCT ~-logRQ).

Table 2. Alterations in selected gene expression in two CLL cell samples (patients: PZ and RJ) after 2 wk of RCC therapy illustrated as fold change and ΔΔCt values in reference to control samples (before therapy)

Reprints and Corporate Permissions

Please note: Selecting permissions does not provide access to the full text of the article, please see our help page How do I view content?

To request a reprint or corporate permissions for this article, please click on the relevant link below:

Academic Permissions

Please note: Selecting permissions does not provide access to the full text of the article, please see our help page How do I view content?

Obtain permissions instantly via Rightslink by clicking on the button below:

If you are unable to obtain permissions via Rightslink, please complete and submit this Permissions form. For more information, please visit our Permissions help page.