Figures & data
Figure 1. Combining GO-203 with taxol and DOX increases the induction of MCF-7 cell apoptosis. (A) Schema of the MUC1-C subunit with the sequence of the 72-amino acid cytoplasmic domain. GO-203 is a D-amino acid peptide that includes a poly-Arg transduction domain and the CQCRRKN sequence (shaded) derived from the MUC1-C cytoplasmic domain. (B) MCF-7 cells were left untreated (control) and treated with 5.6 μM GO-203 (), 28 nM taxol () or the combination of both agents for 72 h. GO-203 was added every 24 h. (C) MCF-7 cells were left untreated (control) and treated with 5.6 M GO-203, 0.33 μM DOX () or the combination of both agents for 72 h. GO-203 was added every 24 h. The cells were fixed and analyzed for cell cycle distribution by flow cytometry. The percentage of sub-G1 cells is included in the panels.
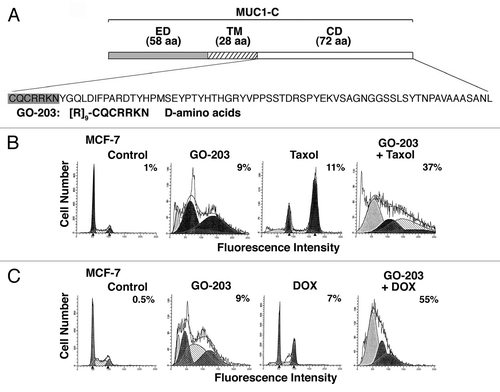
Table 1. IC50 values of GO-203, taxol and DOX
Figure 2. Activation of effector caspase-7 in MCF-7 cells treated with GO-203, taxol and DOX. (A) MCF-7 cells were treated with 5.6 μM GO-203, 28 nM taxol or the combination of both agents for 48 h. GO-203 was added every 24 h. B. MCF-7 cells were treated with 5.6 μM GO-203, 0.33 μM DOX, or the combination of both agents for 48 h. GO-203 was added every 24 h. Cytosolic lysates were immunoblotted with the indicated antibodies (left). Total cell lysates were immunoblotted with anti-PARP and anti-actin (right). FL, full-length; CF, cleaved fragment.
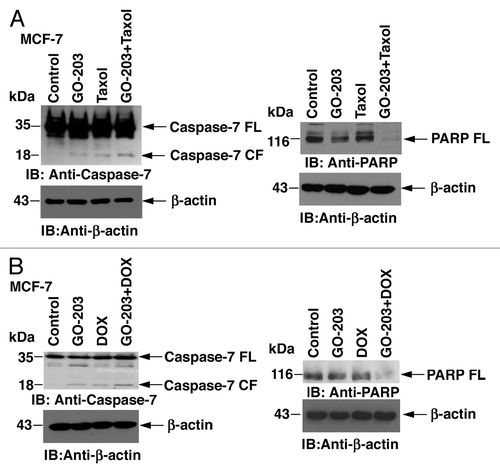
Figure 3. GO-203 increases the apoptotic response of ZR-75-1 cells to taxol and DOX. (A) ZR-75-1 cells were left untreated (control) and treated with 2.9 μM GO-203 (), 85 nM taxol () or the combination of both agents for 72 h. GO-203 was added every 24 h. (B) ZR-75-1 cells were left untreated (control) and treated with the combination of 2.9 μM GO-203 and 85 nM taxol in the absence and presence of 4 μM Z-VAD-FMK for 48 h. GO-203 was added every 24 h. (C) ZR-75-1 cells were left untreated (control) and treated with 2.9 μM GO-203, 0.53 μM DOX () or the combination of both agents for 72 h. GO-203 was added every 24 h. (D) ZR-75-1 cells were left untreated (control) and treated with the combination of 2.9 M GO-203 and 0.53 μM DOX in the absence and presence of 4 μM Z-VAD-FMK for 48 h. GO-203 was added every 24 h. The cells were fixed and analyzed for cell cycle distribution by flow cytometry. The percentage of sub-G1 cells is included in the panels.
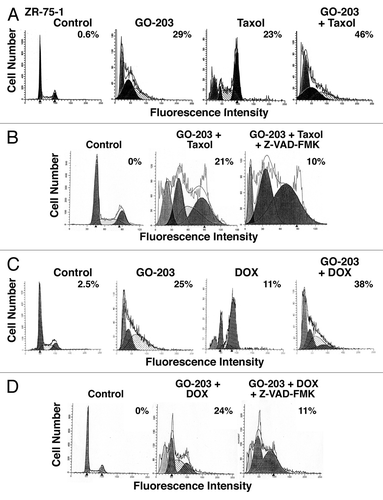
Figure 4. Activation of caspase-3 and caspase-7 in ZR-75-1 cells treated with GO-203 in combination with taxol and DOX. (A) ZR-75-1 cells were treated with 2.9 μM GO-203, 85 nM taxol or the combination of both agents for 48 h. GO-203 was added every 24 h. (B) ZR-75-1 cells were treated with 2.9 μM GO-203, 0.53 μM DOX or the combination of both agents for 48 h. GO-203 was added every 24 h. Cytosolic lysates were immunoblotted with the indicated antibodies (left). Total-cell lysates were immunoblotted with anti-PARP and anti-actin (right). FL, full-length; CF, cleaved fragment.
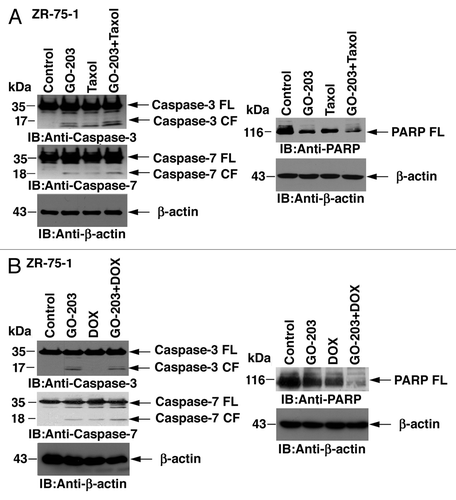
Figure 5. Combining GO-203 with taxol or DOX induces late apoptosis/necrosis. (A) ZR-75-1 cells were treated with 2.9 μM GO-203, 85 nM taxol or the combination of both agents for 48 h. GO-203 was added every 24 h. (B) ZR-75-1 cells were treated with 2.9 μM GO-203, 0.53 μM DOX or the combination of both agents for 48 h. GO-203 was added every 24 h. The cells were then incubated with PI/annexin V and analyzed by flow cytometry. The percentage of necrotic (upper left quadrant), apoptotic (lower right quadrant) and late apoptotic/necrotic (upper right quadrant) cells is indicated in the panels.
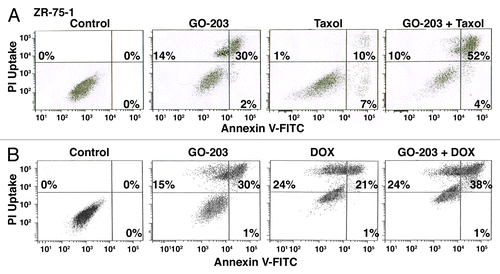
Figure 6. Synergistic interaction of GO-203 in combination with taxol and DOX in the treatment of MCF-7 cells. (A) MCF-7 cells were exposed to fixed IC50 ratios GO-203 alone, taxol alone and the GO-203/taxol combination. The dose-effect curves for GO-203 alone (+), taxol alone (8) and GO-203/taxol (X) are shown in the left panel. The multiple effect-level isobologram analysis is shown in the right panel for the ED90 (solid circles), ED75 (solid squares) and ED50 (solid triangles). The CI values are listed in . (B) MCF-7 cells were treated with fixed IC50 ratios of GO-203 alone, DOX alone and the GO-203/DOX combination. The dose-effect curves for GO-203 alone (+), DOX alone (8) and GO-203/DOX (X) are shown in the left panel. The multiple effect-level isobologram analysis is shown in the right panel for the ED90 (solid circles), ED75 (solid squares) and ED50 (solid triangles). The CI values are listed in .
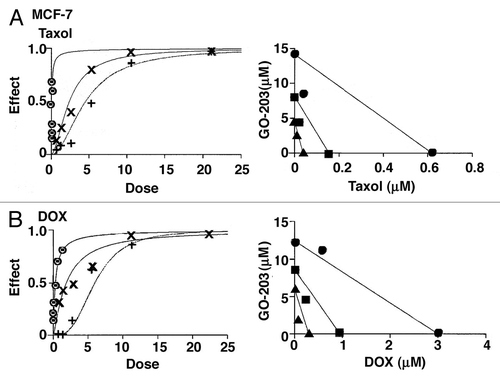
Table 2. Combination indices
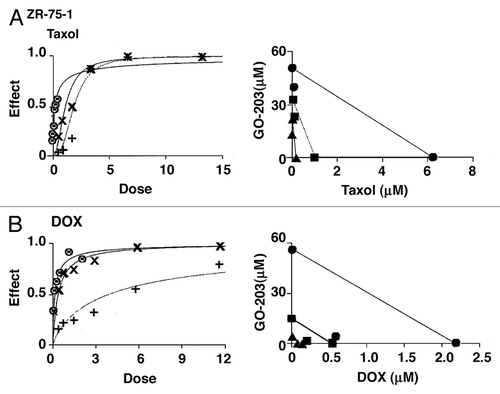
Figure 7. GO-203 is synergistic in combination with taxol and DOX in the ZR-75-1 cell model. (A) ZR-75-1 cells were exposed to fixed IC50 ratios of GO-203 alone, taxol alone and the GO-203/taxol combination. The dose-effect curves for GO-203 alone (+), taxol alone (8) and GO-203/taxol (X) are shown in the left panel. The multiple effect-level isobologram analysis is shown in the right panel for the ED90 (solid circles), ED75 (solid squares) and ED50 (solid triangles). The CI values are listed in . (B) ZR-75-1 cells were treated with fixed IC50 ratios of GO-203 alone, DOX alone and the GO-203/DOX combination. The dose-effect curves for GO-203 alone (+), DOX alone (8) and GO-203/DOX (X) are shown in the left panel. The multiple effect-level isobologram analysis is shown in the right panel for the ED90 (solid circles), ED75 (solid squares) and ED50 (solid triangles). The CI values are listed in .