747
Views
29
CrossRef citations to date
0
Altmetric
Research Paper

IL-17A/IL-17RA interaction promoted metastasis of osteosarcoma cells

, , , &
Pages 155-163 | Received 15 Jul 2012, Accepted 18 Nov 2012, Published online: 28 Nov 2012

Figures & data

Figure 1. Elevated IL-17A expression in OS patients. (A) The serological level of IL-17A was determined by ELISA in 23 NSCLC patients and 16 healthy controls. (B) The serological level of IL-17A in 16 OS patients without metastasis and 7 patients with metastasis. (C) The correlation between serum IL-17A and clinical stage of 23 OS patients was analyzed. (D) The relative expression of IL-17RA mRNA was detected in tumor tissue from 9 OS patients without metastasis and 7 OS patients with metastasis respectively. Each dot represented the data from one OS patient. *p < 0.05.
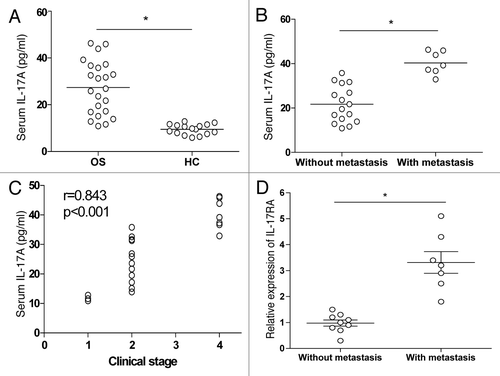
Figure 1. Elevated IL-17A expression in OS patients. (A) The serological level of IL-17A was determined by ELISA in 23 NSCLC patients and 16 healthy controls. (B) The serological level of IL-17A in 16 OS patients without metastasis and 7 patients with metastasis. (C) The correlation between serum IL-17A and clinical stage of 23 OS patients was analyzed. (D) The relative expression of IL-17RA mRNA was detected in tumor tissue from 9 OS patients without metastasis and 7 OS patients with metastasis respectively. Each dot represented the data from one OS patient. *p < 0.05.

Figure 2. IL-17A/IL-17RA interaction promoted the metastasis of OS cells in vitro. (A) 2 × 10⁶ U-2 cells or MG63 cells were treated with the indicated dose IL-17A for 48 h and then assayed for their invasive potential. (B and C) U-2 OS cells (B) or MG63 cells (C) were incubated with 100 ng/ml of IL-17A for the indicated time and assayed for their growth by MTT assay. (D and E) U-2 cells were transiently transfected with IL-17RA siRNA or the control siRNA, and then stimulated with 100ng/ml of IL-17A for 48 h. (F and G) MG63 cells were transiently transfected with IL-17RA expression vector or control vector, and then stimulated with 100 ng/ml of IL-17A for 48 h. Each bar represents the means (± SD) in triplicate from three independent experiments. *p < 0.05.
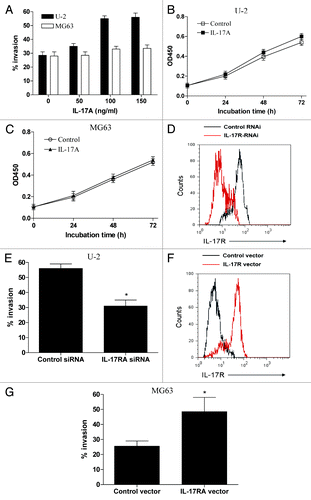
Figure 2. IL-17A/IL-17RA interaction promoted the metastasis of OS cells in vitro. (A) 2 × 10⁶ U-2 cells or MG63 cells were treated with the indicated dose IL-17A for 48 h and then assayed for their invasive potential. (B and C) U-2 OS cells (B) or MG63 cells (C) were incubated with 100 ng/ml of IL-17A for the indicated time and assayed for their growth by MTT assay. (D and E) U-2 cells were transiently transfected with IL-17RA siRNA or the control siRNA, and then stimulated with 100ng/ml of IL-17A for 48 h. (F and G) MG63 cells were transiently transfected with IL-17RA expression vector or control vector, and then stimulated with 100 ng/ml of IL-17A for 48 h. Each bar represents the means (± SD) in triplicate from three independent experiments. *p < 0.05.

Figure 3. IL-17A/IL-17RA interaction elevated the expression of VEGF, MMP9 and CXCR4 in OS cells. (A−C) U-2 OS cells or MG63 cells were incubated with IL-17A (100 ng/ml) for 48 h and then assayed for their expression level of VEGF and MMP9 using western blot. Each bar represents the means (± SD) of the relative intensity of VEGF and MMP9 calculated from three independent experiments. (D and E) U-2 OS cells or MG63 cells were incubated with IL-17A (100 ng/ml) for 48 h and then assayed for their expression of CXCR4 using FACS analysis respectively. The MFI (mean fluorescence intensity) in each group was calculated (E). (F and G) U-2 cells transiently transfected with IL-17RA siRNA (100 nM) or the control siRNA (100 nM) were stimulated with 100ng/ml of IL-17A for 48 h and then assayed for their expression of VEGF, MMP9 and CXCR4. Each bar represents the means (± SD) of their relative intensity calculated from three independent experiments. *p < 0.05.
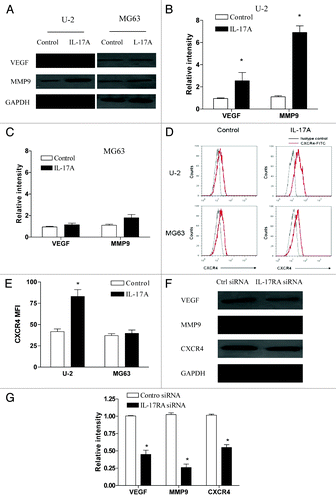
Figure 3. IL-17A/IL-17RA interaction elevated the expression of VEGF, MMP9 and CXCR4 in OS cells. (A−C) U-2 OS cells or MG63 cells were incubated with IL-17A (100 ng/ml) for 48 h and then assayed for their expression level of VEGF and MMP9 using western blot. Each bar represents the means (± SD) of the relative intensity of VEGF and MMP9 calculated from three independent experiments. (D and E) U-2 OS cells or MG63 cells were incubated with IL-17A (100 ng/ml) for 48 h and then assayed for their expression of CXCR4 using FACS analysis respectively. The MFI (mean fluorescence intensity) in each group was calculated (E). (F and G) U-2 cells transiently transfected with IL-17RA siRNA (100 nM) or the control siRNA (100 nM) were stimulated with 100ng/ml of IL-17A for 48 h and then assayed for their expression of VEGF, MMP9 and CXCR4. Each bar represents the means (± SD) of their relative intensity calculated from three independent experiments. *p < 0.05.

Figure 4. IL-17A/IL-17RA interaction induced Stat3 activity in OS cells. (A and B) U-2 OS cells were incubated with IL-17A (100 ng/ml) for 48 h and then assayed for their expression of total Stat3 and phospho-Stat3 using western blot. Each bar represents the means (± SD) of the relative intensity calculated from three independent experiments. (C and D) U-2 cells transiently transfected with IL-17RA siRNA (100 nM) or the control siRNA (100 nM) were stimulated with 100 ng/ml of IL-17A for 48 h and then assayed for their expression of phospho-Stat3 using western blot. Each bar represents the means (± SD) of their relative intensity calculated from three independent experiments. (E) U-2 cells were cultured with IL-7A (100 ng/ml), and the indicated dose of Stat3-specific inhibitory peptide was added to the cultures 1 h before stimulation. After 48 h, the U-2 cells were analyzed for their invasive potential. Each bar represents the means (± SD) in triplicate calculated from three independent experiments. *p < 0.05.
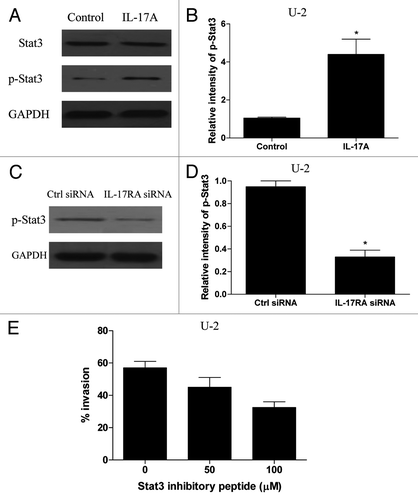
Figure 4. IL-17A/IL-17RA interaction induced Stat3 activity in OS cells. (A and B) U-2 OS cells were incubated with IL-17A (100 ng/ml) for 48 h and then assayed for their expression of total Stat3 and phospho-Stat3 using western blot. Each bar represents the means (± SD) of the relative intensity calculated from three independent experiments. (C and D) U-2 cells transiently transfected with IL-17RA siRNA (100 nM) or the control siRNA (100 nM) were stimulated with 100 ng/ml of IL-17A for 48 h and then assayed for their expression of phospho-Stat3 using western blot. Each bar represents the means (± SD) of their relative intensity calculated from three independent experiments. (E) U-2 cells were cultured with IL-7A (100 ng/ml), and the indicated dose of Stat3-specific inhibitory peptide was added to the cultures 1 h before stimulation. After 48 h, the U-2 cells were analyzed for their invasive potential. Each bar represents the means (± SD) in triplicate calculated from three independent experiments. *p < 0.05.

Figure 5. IL-17A/IL-17RA interaction enhanced the metastasis of OS cells in vivo. (A) 1 × 10⁶ U-2 cells or MG63 cells stably transfected with IL-17A expression vector or control vector were incubated at 6-well plates respectively. After 48 h, the concentration of supernatant IL-17A was determined by ELISA assay. (B) Groups of eight nude mice were challenged with 2 × 10⁶ of U-2 cells or MG63 cells which were stably transfected with IL-17A expression vector or control vector, respectively. (C) Groups of eight nude mice were challenged with 2 × 10⁶ G63 cells which were stably co-transfected with IL-17A expression vector and IL-17RA expression vector, or the corresponding control vector, respectively. After 30 d, the metastatic index to lung was determined. Each bar represents the means (± SD) in each group. *p < 0.05
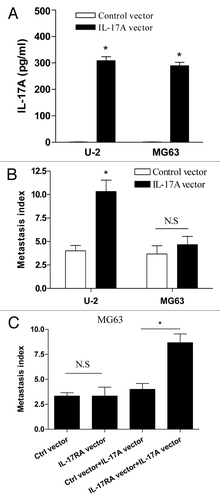
Figure 5. IL-17A/IL-17RA interaction enhanced the metastasis of OS cells in vivo. (A) 1 × 10⁶ U-2 cells or MG63 cells stably transfected with IL-17A expression vector or control vector were incubated at 6-well plates respectively. After 48 h, the concentration of supernatant IL-17A was determined by ELISA assay. (B) Groups of eight nude mice were challenged with 2 × 10⁶ of U-2 cells or MG63 cells which were stably transfected with IL-17A expression vector or control vector, respectively. (C) Groups of eight nude mice were challenged with 2 × 10⁶ G63 cells which were stably co-transfected with IL-17A expression vector and IL-17RA expression vector, or the corresponding control vector, respectively. After 30 d, the metastatic index to lung was determined. Each bar represents the means (± SD) in each group. *p < 0.05

Reprints and Corporate Permissions

Please note: Selecting permissions does not provide access to the full text of the article, please see our help page How do I view content?

To request a reprint or corporate permissions for this article, please click on the relevant link below:

Academic Permissions

Please note: Selecting permissions does not provide access to the full text of the article, please see our help page How do I view content?

Obtain permissions instantly via Rightslink by clicking on the button below:

If you are unable to obtain permissions via Rightslink, please complete and submit this Permissions form. For more information, please visit our Permissions help page.