860
Views
14
CrossRef citations to date
0
Altmetric
Research Paper

A new rat model of bone cancer pain produced by rat breast cancer cells implantation of the shaft of femur at the third trochanter level

, , , , , & show all
Pages 193-199 | Received 18 Jul 2012, Accepted 15 Dec 2012, Published online: 19 Dec 2012

Figures & data

Figure 1. Evaluation of pain behaviors following the implantation of Walker 256 cells in rat left femur. (A) Movement-evoked pain was determined using limb use score. Significant impaired limb use was observed at days 14 and 21. (B) Spontaneous flinching and guarding times across 2 min indicate spontaneous pain behaviors and the significant differences were found at days 7, 14 and 21. (C) Mechanical allodynia was determined using the von Frey test. The withdrawal threshold diminishes progressively from day 6. All graphs show means ± SEM, n = 10 rats/group, *p < 0.05.
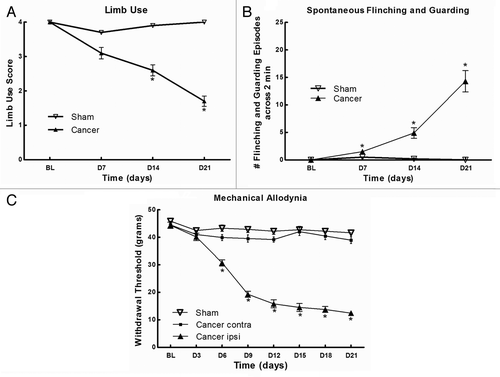
Figure 1. Evaluation of pain behaviors following the implantation of Walker 256 cells in rat left femur. (A) Movement-evoked pain was determined using limb use score. Significant impaired limb use was observed at days 14 and 21. (B) Spontaneous flinching and guarding times across 2 min indicate spontaneous pain behaviors and the significant differences were found at days 7, 14 and 21. (C) Mechanical allodynia was determined using the von Frey test. The withdrawal threshold diminishes progressively from day 6. All graphs show means ± SEM, n = 10 rats/group, *p < 0.05.

Figure 2. MRI images of bone cancer-bearing rat femurs. Sagittal planes of the femur at different stages of tumor progression. T2 magnetic resonance images (MRI) of a rat coping with femoral bone show tumor-affected part of the femur (red line). Tumor proliferation affects the regular cortical line at day 14 (white arrowhead).
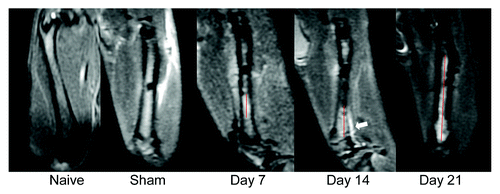
Figure 2. MRI images of bone cancer-bearing rat femurs. Sagittal planes of the femur at different stages of tumor progression. T2 magnetic resonance images (MRI) of a rat coping with femoral bone show tumor-affected part of the femur (red line). Tumor proliferation affects the regular cortical line at day 14 (white arrowhead).

Figure 3. Hematoxylin and eosin staining in the rat femur at day 14 post-surgery. Panels (A) and (B) demonstrate the sham surgery group showing healthy bone structures. And panels (C) and (D) demonstrate that breast cancer cells filled the intramedullary space of the femur. (A and C: original magnification 40× ; B and D: original magnification 200× ).
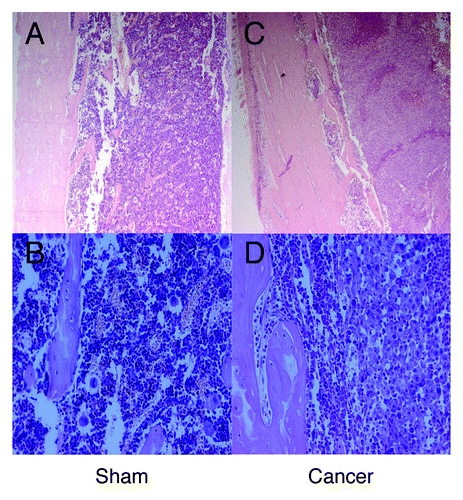
Figure 3. Hematoxylin and eosin staining in the rat femur at day 14 post-surgery. Panels (A) and (B) demonstrate the sham surgery group showing healthy bone structures. And panels (C) and (D) demonstrate that breast cancer cells filled the intramedullary space of the femur. (A and C: original magnification 40× ; B and D: original magnification 200× ).

Figure 4. Immunohistochemical staining of spinal c-Fos, TRPV1 and SP. (A–F) Photographs of c-fos, TRPV1 and SP proteins’ ipsilateral dorsal horn profiles in both cancer-bearing and sham rats, respectively. (G) Number of c-fos and TRPV1 positive neurons in selected areas (black box, randomly selected 3 fields under 200 × magnification) for sham and cancer rats. Data are mean ± SEM, **p < 0.01.
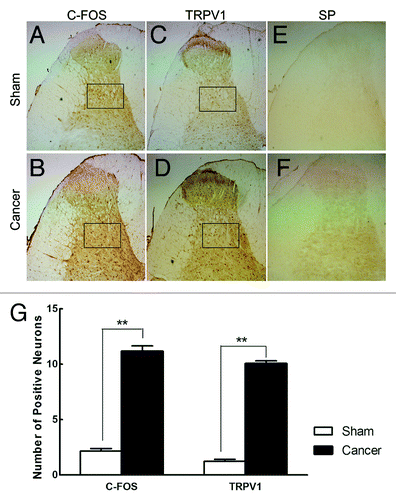
Figure 4. Immunohistochemical staining of spinal c-Fos, TRPV1 and SP. (A–F) Photographs of c-fos, TRPV1 and SP proteins’ ipsilateral dorsal horn profiles in both cancer-bearing and sham rats, respectively. (G) Number of c-fos and TRPV1 positive neurons in selected areas (black box, randomly selected 3 fields under 200 × magnification) for sham and cancer rats. Data are mean ± SEM, **p < 0.01.

Figure 5. The expression of c-fos protein determined by western blot in naive, sham, day 7, 14, 21 rats. (A) The western blot results of c-fos and GAPDH were showed. (B) C-fos/GAPDH ratio histogram reveals that the c-fos expression were significantly higher in day 7, day 14, day 21 than in sham group. *p < 0.05, **p < 0.01.

Figure 5. The expression of c-fos protein determined by western blot in naive, sham, day 7, 14, 21 rats. (A) The western blot results of c-fos and GAPDH were showed. (B) C-fos/GAPDH ratio histogram reveals that the c-fos expression were significantly higher in day 7, day 14, day 21 than in sham group. *p < 0.05, **p < 0.01.
Supplemental material

Additional material

Download Zip (4.6 MB)

Reprints and Corporate Permissions

Please note: Selecting permissions does not provide access to the full text of the article, please see our help page How do I view content?

To request a reprint or corporate permissions for this article, please click on the relevant link below:

Academic Permissions

Please note: Selecting permissions does not provide access to the full text of the article, please see our help page How do I view content?

Obtain permissions instantly via Rightslink by clicking on the button below:

If you are unable to obtain permissions via Rightslink, please complete and submit this Permissions form. For more information, please visit our Permissions help page.