1,170
Views
38
CrossRef citations to date
0
Altmetric
Research Paper

Novel Hsp90 inhibitor NVP-AUY922 radiosensitizes prostate cancer cells

, , , , , , , , , , , , , , , & show all
Pages 347-356 | Received 12 Dec 2012, Accepted 15 Jan 2013, Published online: 28 Jan 2013

Figures & data

Figure 1. AUY922 radiosensitizes prostate cancer cell lines, Myc-CaP and PC3, in vitro. (A–B) Cells were exposed to 24 h of AUY922 at the indicated concentration prior to protein extraction. Western blotting indicated a downregulation of phospho-S6 and androgen receptor (AR), but upregulation of Hsp72 following AUY922 exposure. Clonogenic survival assay depicting the anti-cancer activity of AUY922 used as a single agent in both (C) Myc-CaP and (D) PC3 cells (p < 0.001). Clonogenic survival assays for (E) Myc-CaP and (F) PC3 cells demonstrated AUY922-induced radiosensitization in both cells lines with enhancement ratios of 1.74 (SD = 0.2) and 1.47 (SD = 0.11), respectively. All experiments were done in triplicate and repeated at least three times.
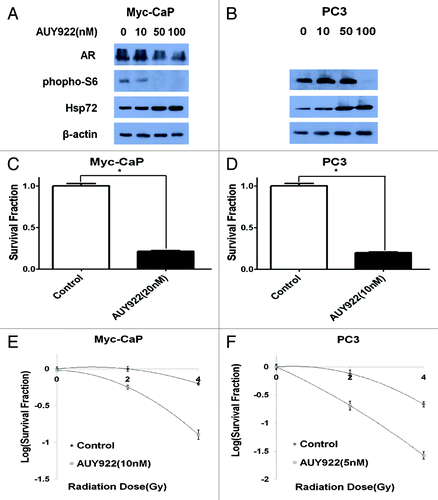
Figure 1. AUY922 radiosensitizes prostate cancer cell lines, Myc-CaP and PC3, in vitro. (A–B) Cells were exposed to 24 h of AUY922 at the indicated concentration prior to protein extraction. Western blotting indicated a downregulation of phospho-S6 and androgen receptor (AR), but upregulation of Hsp72 following AUY922 exposure. Clonogenic survival assay depicting the anti-cancer activity of AUY922 used as a single agent in both (C) Myc-CaP and (D) PC3 cells (p < 0.001). Clonogenic survival assays for (E) Myc-CaP and (F) PC3 cells demonstrated AUY922-induced radiosensitization in both cells lines with enhancement ratios of 1.74 (SD = 0.2) and 1.47 (SD = 0.11), respectively. All experiments were done in triplicate and repeated at least three times.

Figure 2. AUY922 given concurrently with radiation (RT) increases the proportion of cells undergoing apoptosis compared with RT alone in vitro. (A) PC3 cells were incubated with or without 100 nM AUY922 for 24 h prior to RT and assessed 24 h post-RT for Annexin V-FITC and propidium iodide using flow cytometry. Representative flow cytometry plots for each of the four treatment arms are shown: from left to right—Control, AUY922 alone, RT alone and combined RT and AUY922 (RT-AUY922). (B) Myc-CaP cells were treated with 100 nM AUY922 and processed for flow cytometry similarly as for PC3 cells above. (C) Cells in the early phases of apoptosis (Annexin V high and propidium iodide low) and cells in the late phases of apoptosis (Annexin V high and propidium iodide high) are summed together and plotted as “% apoptotic cells” with SEM for both cell lines. Asterisks represent statistically significant differences between the treatment groups by Student’s t-test (all p < 0.03). All experiments were done in triplicate and repeated at least twice.
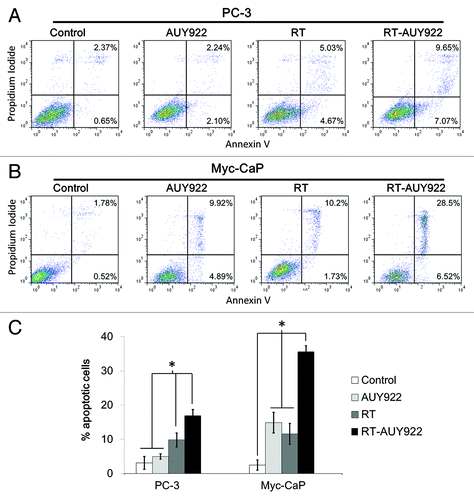
Figure 2. AUY922 given concurrently with radiation (RT) increases the proportion of cells undergoing apoptosis compared with RT alone in vitro. (A) PC3 cells were incubated with or without 100 nM AUY922 for 24 h prior to RT and assessed 24 h post-RT for Annexin V-FITC and propidium iodide using flow cytometry. Representative flow cytometry plots for each of the four treatment arms are shown: from left to right—Control, AUY922 alone, RT alone and combined RT and AUY922 (RT-AUY922). (B) Myc-CaP cells were treated with 100 nM AUY922 and processed for flow cytometry similarly as for PC3 cells above. (C) Cells in the early phases of apoptosis (Annexin V high and propidium iodide low) and cells in the late phases of apoptosis (Annexin V high and propidium iodide high) are summed together and plotted as “% apoptotic cells” with SEM for both cell lines. Asterisks represent statistically significant differences between the treatment groups by Student’s t-test (all p < 0.03). All experiments were done in triplicate and repeated at least twice.

Figure 3. Mechanisms of AUY922 mediated radiosensitization in vitro. (A) Unsynchronized Myc-CaP cells were exposed to vehicle control, 20 nM AUY922 or 50 nM AUY922 for 24 h and then fixed with ethanol for cell cycle analysis. (B) PC3 cells were synchronized, then re-fed with complete medium (10% serum) either containing vehicle control, 10 nM AUY922 or 50 nM AUY922 for 24 h and then fixed with ethanol for cell cycle analysis. Percent of cells in G1, S and G2 phases with SEM is plotted for control and AUY922 arms, with corresponding histograms generated from flow cytometry shown below each bar plot. Treatment with AUY922 caused a G2-M arrest in unsynchronized Myc-CaP and synchronized PC3 cells at a similar time radiation would be delivered in clonogenic survival experiments in . Asterisks denote significant differences from corresponding columns in the control arm for each cell line by Student’s t-test (all p < 0.001). (C) Immunofluorescence (IF) for γ-H2AX foci and then staining for DAPI were performed (note: the t = 0 time point actually represents cells that were fixed at < 30 min post-irradiation). Fluorescent images were captured at 63x using a fluorescent microscope with uniform exposures of 24 ms for DAPI and 900 ms for Alexa Fluor 488 used for Myc-CaP cells. Images for PC3 cells were taken with uniform exposures of 50ms for DAPI and 1500 for Alexa Fluor 488. Representative images are shown for the Myc-CaP and PC3 cells at 6h and 24h respectively, for each of the treatment arms. The percent of nuclei demonstrating high (> 25), moderate (10–25), low (< 10) or no γ-H2AX foci was quantitated for both (D) Myc-CaP and (E) PC3 cell lines at the time points depicted by counting ≥ 3 representative high-power fields (HPF). The results of this quantitation were represented graphically with SEM for each treatment arm of each cell line (D and E). For both cell lines, radiation and AUY922 (RTAUY922) resulted in a greater percent of nuclei with a high number of γ-H2AX foci at both time points as compared with all of the other arms (p < 0.05). Asterisks represent significant differences between treatment arms by Fisher’s exact test as indicated by accompanying brackets. All experiments were done in triplicate and repeated. (F) Cells were exposed to 24 h of AUY922 at the indicated concentration prior to western blotting for DNA damage response regulator Chk1.
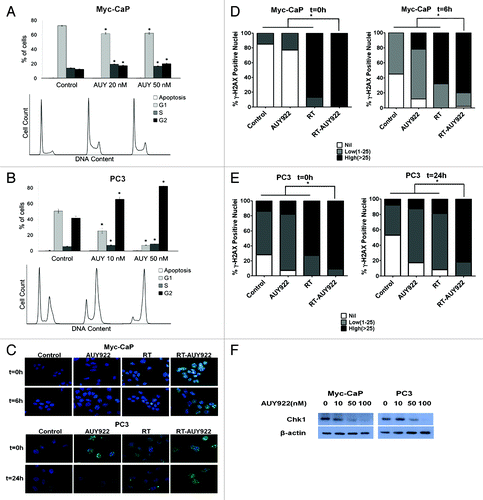
Figure 3. Mechanisms of AUY922 mediated radiosensitization in vitro. (A) Unsynchronized Myc-CaP cells were exposed to vehicle control, 20 nM AUY922 or 50 nM AUY922 for 24 h and then fixed with ethanol for cell cycle analysis. (B) PC3 cells were synchronized, then re-fed with complete medium (10% serum) either containing vehicle control, 10 nM AUY922 or 50 nM AUY922 for 24 h and then fixed with ethanol for cell cycle analysis. Percent of cells in G1, S and G2 phases with SEM is plotted for control and AUY922 arms, with corresponding histograms generated from flow cytometry shown below each bar plot. Treatment with AUY922 caused a G2-M arrest in unsynchronized Myc-CaP and synchronized PC3 cells at a similar time radiation would be delivered in clonogenic survival experiments in Figure 1. Asterisks denote significant differences from corresponding columns in the control arm for each cell line by Student’s t-test (all p < 0.001). (C) Immunofluorescence (IF) for γ-H2AX foci and then staining for DAPI were performed (note: the t = 0 time point actually represents cells that were fixed at < 30 min post-irradiation). Fluorescent images were captured at 63x using a fluorescent microscope with uniform exposures of 24 ms for DAPI and 900 ms for Alexa Fluor 488 used for Myc-CaP cells. Images for PC3 cells were taken with uniform exposures of 50ms for DAPI and 1500 for Alexa Fluor 488. Representative images are shown for the Myc-CaP and PC3 cells at 6h and 24h respectively, for each of the treatment arms. The percent of nuclei demonstrating high (> 25), moderate (10–25), low (< 10) or no γ-H2AX foci was quantitated for both (D) Myc-CaP and (E) PC3 cell lines at the time points depicted by counting ≥ 3 representative high-power fields (HPF). The results of this quantitation were represented graphically with SEM for each treatment arm of each cell line (D and E). For both cell lines, radiation and AUY922 (RTAUY922) resulted in a greater percent of nuclei with a high number of γ-H2AX foci at both time points as compared with all of the other arms (p < 0.05). Asterisks represent significant differences between treatment arms by Fisher’s exact test as indicated by accompanying brackets. All experiments were done in triplicate and repeated. (F) Cells were exposed to 24 h of AUY922 at the indicated concentration prior to western blotting for DNA damage response regulator Chk1.

Figure 4. AUY922 radiosensitizes prostate cancer cell lines, Myc-CaP and PC3, in vivo. A hind-flank tumor growth delay model (see Materials and Methods) was used to assay the following treatment arms: (1) no treatment; (2) fractionated radiation 2 Gy × 3 (RT); (3) AUY922 and (4) AUY922 and RT (RT-AUY922) n > 5 mice per arm repeated twice in the Myc-CaP model and n > 3 mice per arm in PC3 model. The results of the experiment were analyzed using (A and B) fold tumor volume change over time, (C and D) mean time to quadruple the pre-treatment tumor volume and (E and F) Kaplan-Meier survival analysis where the time for quadrupling the pretreatment tumor volume was considered the event of interest. The RT-AUY922 arm was significantly different from any of the other arms using Mann-Whitney-U test and log-rank test for the Myc-CaP model (p < 0.05). The same trend was observed in the PC3 model (p < 0.01). The AUY922 alone and RT alone arms were significantly different from one another in the PC3 model but not in the Myc-CaP model (p = 0.0056 and p = 0.1123 by log-rank test, respectively).
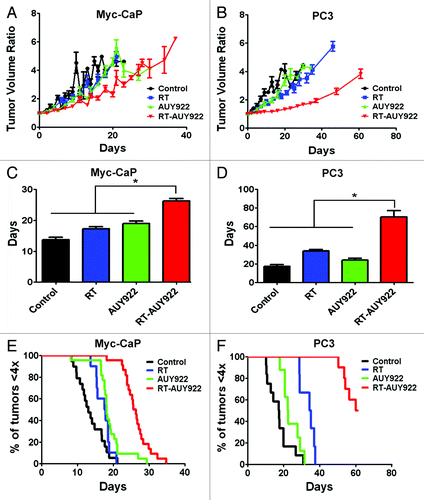
Figure 4. AUY922 radiosensitizes prostate cancer cell lines, Myc-CaP and PC3, in vivo. A hind-flank tumor growth delay model (see Materials and Methods) was used to assay the following treatment arms: (1) no treatment; (2) fractionated radiation 2 Gy × 3 (RT); (3) AUY922 and (4) AUY922 and RT (RT-AUY922) n > 5 mice per arm repeated twice in the Myc-CaP model and n > 3 mice per arm in PC3 model. The results of the experiment were analyzed using (A and B) fold tumor volume change over time, (C and D) mean time to quadruple the pre-treatment tumor volume and (E and F) Kaplan-Meier survival analysis where the time for quadrupling the pretreatment tumor volume was considered the event of interest. The RT-AUY922 arm was significantly different from any of the other arms using Mann-Whitney-U test and log-rank test for the Myc-CaP model (p < 0.05). The same trend was observed in the PC3 model (p < 0.01). The AUY922 alone and RT alone arms were significantly different from one another in the PC3 model but not in the Myc-CaP model (p = 0.0056 and p = 0.1123 by log-rank test, respectively).

Reprints and Corporate Permissions

Please note: Selecting permissions does not provide access to the full text of the article, please see our help page How do I view content?

To request a reprint or corporate permissions for this article, please click on the relevant link below:

Academic Permissions

Please note: Selecting permissions does not provide access to the full text of the article, please see our help page How do I view content?

Obtain permissions instantly via Rightslink by clicking on the button below:

If you are unable to obtain permissions via Rightslink, please complete and submit this Permissions form. For more information, please visit our Permissions help page.