657
Views
1
CrossRef citations to date
0
Altmetric
Research Paper

Homologous recombination-based adenovirus vector system for tumor cell-specific gene delivery

, , , , , , & show all
Pages 728-735 | Received 08 Mar 2013, Accepted 19 May 2013, Published online: 12 Jun 2013

Figures & data

Figure 1. (A) Schematic structure of Ad.CMV.IR, Ad.IR.EGFP, and Ad.IR.EGFP/E1a. (B) HRAVS, which is composed of Ad.CMV.IR and Ad.IR.EGFP, specifically replicates in tumor cells. The homologous recombination is activated, leading to the formation of Ad.CMV.IR.EGFP and EGFP expression. (C) EHRAVS, which is composed of Ad.CMV.IR and Ad.IR.EGFP/E1a, specifically replicates in tumor cells. The homologous recombination between the two viruses results in the production of Ad.CMV.IR.EGFP/E1a, which expresses both EGFP and E1a, and the latter can enhance the virus replication in the tumor cells.
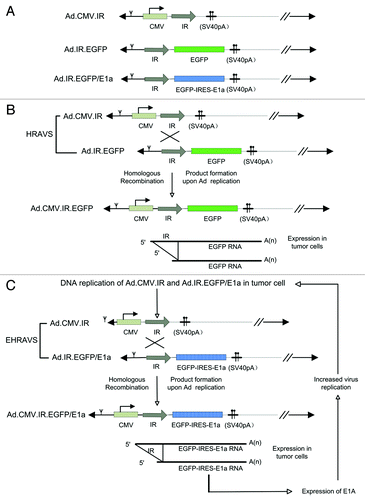
Figure 1. (A) Schematic structure of Ad.CMV.IR, Ad.IR.EGFP, and Ad.IR.EGFP/E1a. (B) HRAVS, which is composed of Ad.CMV.IR and Ad.IR.EGFP, specifically replicates in tumor cells. The homologous recombination is activated, leading to the formation of Ad.CMV.IR.EGFP and EGFP expression. (C) EHRAVS, which is composed of Ad.CMV.IR and Ad.IR.EGFP/E1a, specifically replicates in tumor cells. The homologous recombination between the two viruses results in the production of Ad.CMV.IR.EGFP/E1a, which expresses both EGFP and E1a, and the latter can enhance the virus replication in the tumor cells.

Figure 2. EGFP expression in the cells infected with HRAVS at MOI of 100. (A) The tumor and normal cells were infected with HRAVS at 1:1 of Ad.CMV.IR to Ad.IR.EGFP. After 72 h, the EGFP expression was examined through fluorescence assay in the HCS system. (B) The EGFP expression in A549 cells were examined after 72 h treatment with HRAVS at various ratios of Ad.CMV.IR to Ad.IR.EGFP. (C) Time course of the EGFP expression in A549 and MRC-5 cells. The cells were infected with HRAVS at 30:70 of Ad.CMV.IR to Ad.IR.EGFP.
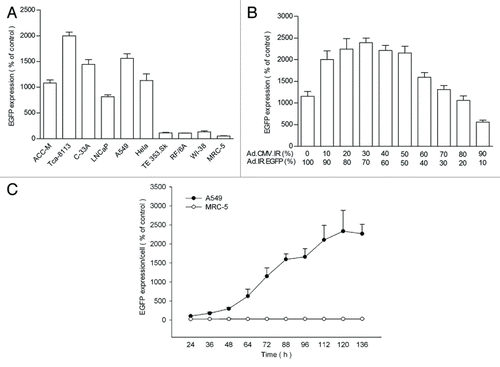
Figure 2. EGFP expression in the cells infected with HRAVS at MOI of 100. (A) The tumor and normal cells were infected with HRAVS at 1:1 of Ad.CMV.IR to Ad.IR.EGFP. After 72 h, the EGFP expression was examined through fluorescence assay in the HCS system. (B) The EGFP expression in A549 cells were examined after 72 h treatment with HRAVS at various ratios of Ad.CMV.IR to Ad.IR.EGFP. (C) Time course of the EGFP expression in A549 and MRC-5 cells. The cells were infected with HRAVS at 30:70 of Ad.CMV.IR to Ad.IR.EGFP.

Figure 3. EGFP expression and virus yield of the cells treated by HRAVS (30:70 of Ad.CMV.IR to Ad.IR.EGFP) or EHRAVS (30:70 of Ad.CMV.IR to Ad.IR.EGFP/E1a). (A) Real-time PCR analysis of EGFP expression. At indicated time points, total RNA was isolated from the cells infected with HRAVS or EHRAVS. The transcripts of EGFP were quantified using β-actin as an internal control. *P < 0.05, **P < 0.01, and ***P < 0.001 as compared with HRAVS at 48, 74, and 96 h, respectively. (B) Tumor and normal cells were infected with HRAVS or EHRAVS at MOI of 100. After 72 h, EGFP protein expression was examined through fluorescence assay in the HCS system. **P < 0.01 as compared with HRAVS. (C) Cultured cells were infected with HRAVS or EHRAVS at MOI of 30. Cell lysates were harvested at 48 h and titered by plaque assay on HEK-293 cells for virus yield assay. ***P < 0.001 as compared with HRAVS.
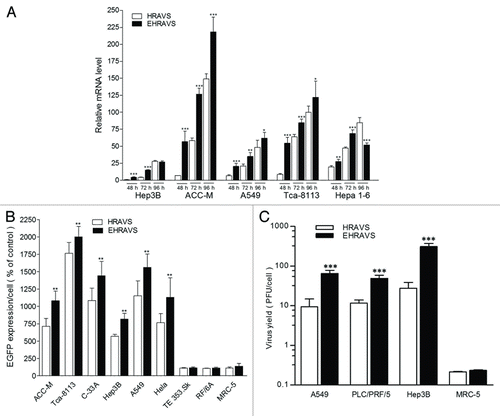
Figure 3. EGFP expression and virus yield of the cells treated by HRAVS (30:70 of Ad.CMV.IR to Ad.IR.EGFP) or EHRAVS (30:70 of Ad.CMV.IR to Ad.IR.EGFP/E1a). (A) Real-time PCR analysis of EGFP expression. At indicated time points, total RNA was isolated from the cells infected with HRAVS or EHRAVS. The transcripts of EGFP were quantified using β-actin as an internal control. *P < 0.05, **P < 0.01, and ***P < 0.001 as compared with HRAVS at 48, 74, and 96 h, respectively. (B) Tumor and normal cells were infected with HRAVS or EHRAVS at MOI of 100. After 72 h, EGFP protein expression was examined through fluorescence assay in the HCS system. **P < 0.01 as compared with HRAVS. (C) Cultured cells were infected with HRAVS or EHRAVS at MOI of 30. Cell lysates were harvested at 48 h and titered by plaque assay on HEK-293 cells for virus yield assay. ***P < 0.001 as compared with HRAVS.

Figure 4. Viability and apoptosis of the cells treated with HRAVS (30:70 of Ad.CMV.IR to Ad.IR.EGFP) or EHRAVS (30:70 of Ad.CMV.IR to Ad.IR.EGFP/E1a) (A) Effect of adenovirus infection on cell viability. After 6 h treatment with HRAVS or EHRAVS, CCK-8 solution was added for additional 2 h incubation. Results were determined at the absorbance of 450 nm on a Bio-Rad Model 550 Microplate Reader relative to cell controls as designated 100%. **P < 0.01, *P < 0.05 as compared with HRAVS. (B) Apoptosis assay after adenovirus infection. Cells were infected with HRAVS or EHRAVS at MOI of 100. After 72 h, The apoptosis assay was performed using FITC Annexin V Apoptosis Detection Kit I on a FACSCalibur flow cytometer.
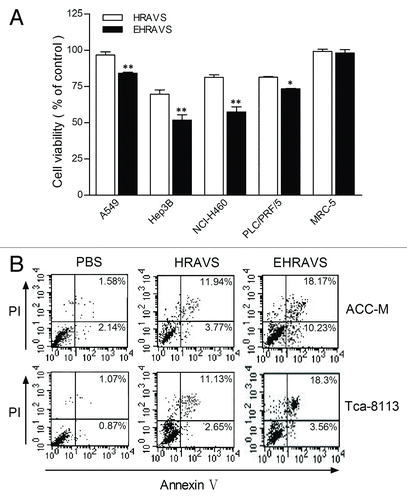
Figure 4. Viability and apoptosis of the cells treated with HRAVS (30:70 of Ad.CMV.IR to Ad.IR.EGFP) or EHRAVS (30:70 of Ad.CMV.IR to Ad.IR.EGFP/E1a) (A) Effect of adenovirus infection on cell viability. After 6 h treatment with HRAVS or EHRAVS, CCK-8 solution was added for additional 2 h incubation. Results were determined at the absorbance of 450 nm on a Bio-Rad Model 550 Microplate Reader relative to cell controls as designated 100%. **P < 0.01, *P < 0.05 as compared with HRAVS. (B) Apoptosis assay after adenovirus infection. Cells were infected with HRAVS or EHRAVS at MOI of 100. After 72 h, The apoptosis assay was performed using FITC Annexin V Apoptosis Detection Kit I on a FACSCalibur flow cytometer.

Figure 5. The MMP assay of the cells infected with HRAVS (30:70 of Ad.CMV.IR to Ad.IR.EGFP) or EHRAVS (30:70 of Ad.CMV.IR to Ad.IR.EGFP/E1a). The cells were pretreated with PBS, HRAVS or EHRAVS at MOI of 100. After 48 h, the MMP was determined by Mitotracker red staining and fluorescence assay. The red fluorescence can selectively accumulate in mitochondria of ACC-M (A) and Tca-8113 (C) cells and represents as a function of the cell MMP. Quantitation of fluorescence intensity in ACC-M (B) and Tca-8113 (D) cells. **P < 0.01 as compared with PBS group; ##P < 0.01, #P < 0.05 as compared with HRAVS.
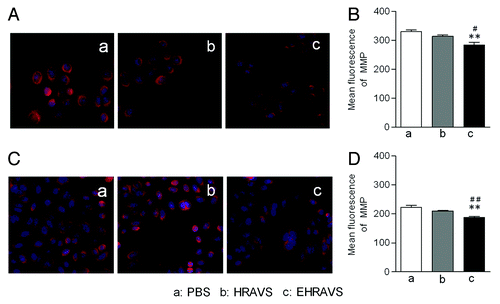
Figure 5. The MMP assay of the cells infected with HRAVS (30:70 of Ad.CMV.IR to Ad.IR.EGFP) or EHRAVS (30:70 of Ad.CMV.IR to Ad.IR.EGFP/E1a). The cells were pretreated with PBS, HRAVS or EHRAVS at MOI of 100. After 48 h, the MMP was determined by Mitotracker red staining and fluorescence assay. The red fluorescence can selectively accumulate in mitochondria of ACC-M (A) and Tca-8113 (C) cells and represents as a function of the cell MMP. Quantitation of fluorescence intensity in ACC-M (B) and Tca-8113 (D) cells. **P < 0.01 as compared with PBS group; ##P < 0.01, #P < 0.05 as compared with HRAVS.

Table 1. Primers used in real time PCR analysis

Reprints and Corporate Permissions

Please note: Selecting permissions does not provide access to the full text of the article, please see our help page How do I view content?

To request a reprint or corporate permissions for this article, please click on the relevant link below:

Academic Permissions

Please note: Selecting permissions does not provide access to the full text of the article, please see our help page How do I view content?

Obtain permissions instantly via Rightslink by clicking on the button below:

If you are unable to obtain permissions via Rightslink, please complete and submit this Permissions form. For more information, please visit our Permissions help page.