1,222
Views
14
CrossRef citations to date
0
Altmetric
Research Paper

A Smac mimetic augments the response of urothelial cancer cells to gemcitabine and cisplatin

, , , , &
Pages 812-822 | Received 08 Mar 2013, Accepted 08 Jun 2013, Published online: 19 Jun 2013

Figures & data

Figure 1. AZ58 overcomes resistance to gemcitabine and cisplatin in select urothelial cancer cell lines. Ten urothelial cancer cell lines were exposed to 1 μM each of gemcitabine and cisplatin for 48 h. Cells were harvested for PI-FACS analysis. Asterisks indicate cell lines sensitive to the drug combination (30% DNA fragmentation). Error bars = standard error. The same 10 urothelial cancer cell lines were exposed to AZ58 at 30 nM in addition to gemcitabine and cisplatin. Double asterisks indicate cell lines sensitive to the drug combination (30% DNA fragmentation).
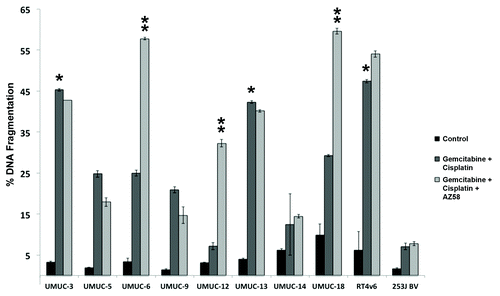
Figure 1. AZ58 overcomes resistance to gemcitabine and cisplatin in select urothelial cancer cell lines. Ten urothelial cancer cell lines were exposed to 1 μM each of gemcitabine and cisplatin for 48 h. Cells were harvested for PI-FACS analysis. Asterisks indicate cell lines sensitive to the drug combination (30% DNA fragmentation). Error bars = standard error. The same 10 urothelial cancer cell lines were exposed to AZ58 at 30 nM in addition to gemcitabine and cisplatin. Double asterisks indicate cell lines sensitive to the drug combination (30% DNA fragmentation).

Figure 2. Constitutive protein expression is not predictive of drug (chemotherapy and/or Smac mimetic) sensitivity. Western blotting analysis of the ten urothelial cancer cell lines for baseline expression of IAP family, BCL family and Smac protein.
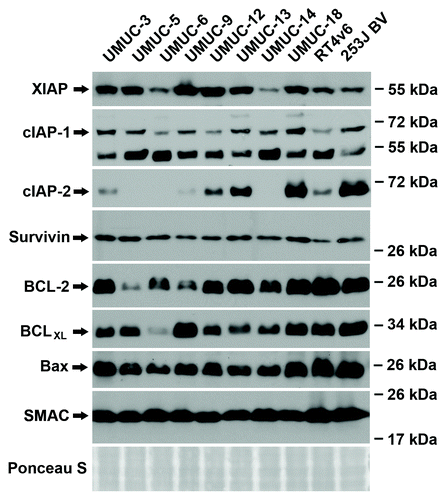
Figure 2. Constitutive protein expression is not predictive of drug (chemotherapy and/or Smac mimetic) sensitivity. Western blotting analysis of the ten urothelial cancer cell lines for baseline expression of IAP family, BCL family and Smac protein.

Figure 3. AZ58 potentiates cell death through apoptosis. (A) Western blotting of the urothelial cancer cell lines considered resistant to gemcitabine and cisplatin (UMUC-12, UMUC-6, and UMUC-9). Treatment conditions are as labeled. (B) Image J quantitation of caspase cleavage products. Bar graphs demonstrate relative densities compared with the control. (C) Corresponding graphs of DNA fragmentation from PI-FACS are demonstrated.
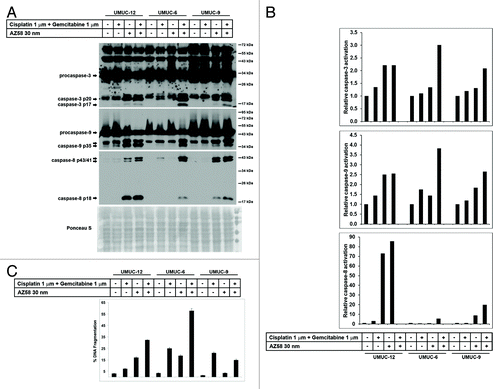
Figure 3. AZ58 potentiates cell death through apoptosis. (A) Western blotting of the urothelial cancer cell lines considered resistant to gemcitabine and cisplatin (UMUC-12, UMUC-6, and UMUC-9). Treatment conditions are as labeled. (B) Image J quantitation of caspase cleavage products. Bar graphs demonstrate relative densities compared with the control. (C) Corresponding graphs of DNA fragmentation from PI-FACS are demonstrated.

Figure 4. Degradation of cIAP-1 corresponds to cell death conditions in urothelial cancer cell lines identified as resistant to gemcitabine and cisplatin. Western blotting of urothelial cancer cell lines resistant to gemcitabine and cisplatin were subjected to various conditions as indicated. Antibodies for selected members of the IAP family, BCL family, and Smac were immunoblotted.
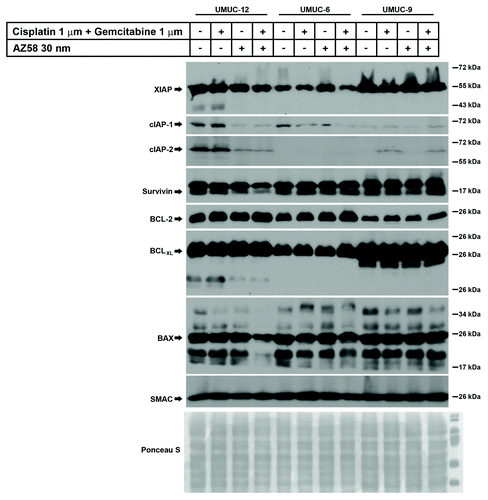
Figure 4. Degradation of cIAP-1 corresponds to cell death conditions in urothelial cancer cell lines identified as resistant to gemcitabine and cisplatin. Western blotting of urothelial cancer cell lines resistant to gemcitabine and cisplatin were subjected to various conditions as indicated. Antibodies for selected members of the IAP family, BCL family, and Smac were immunoblotted.

Figure 5. AZ58 treatment results in reduced tumor burden; however, in a non-statistically significant fashion. (A) Microscopy of UMUC-6 cells demonstrating differential cell death in the various treatment conditions as labeled. Corresponding images show resultant graphs of PI-FACS demonstrating DNA fragmentation. (B) Female athymic nude mice were injected with UMUC-6 cells and treated as described in Materials and Methods. Tumor volumes were calculated and plotted. n = 6 mice for each condition. Error bars = standard error. (C) TUNEL staining of fragmented apoptotic DNA/nuclei to detect the efficacy of AZ58 and chemotherapy in vivo (green) and the total nuclei stained using propidium iodide (Red). Magnification 10 ×. (D) Mean number of TUNEL positive nuclei from 10 representative images.
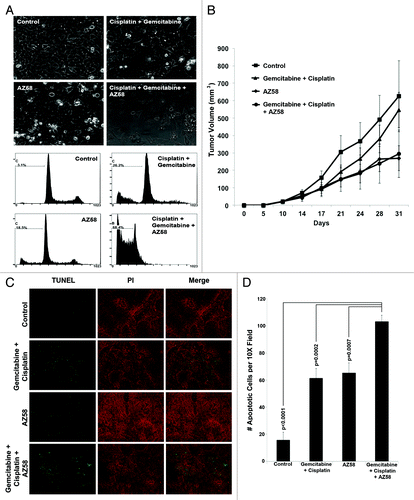
Figure 5. AZ58 treatment results in reduced tumor burden; however, in a non-statistically significant fashion. (A) Microscopy of UMUC-6 cells demonstrating differential cell death in the various treatment conditions as labeled. Corresponding images show resultant graphs of PI-FACS demonstrating DNA fragmentation. (B) Female athymic nude mice were injected with UMUC-6 cells and treated as described in Materials and Methods. Tumor volumes were calculated and plotted. n = 6 mice for each condition. Error bars = standard error. (C) TUNEL staining of fragmented apoptotic DNA/nuclei to detect the efficacy of AZ58 and chemotherapy in vivo (green) and the total nuclei stained using propidium iodide (Red). Magnification 10 ×. (D) Mean number of TUNEL positive nuclei from 10 representative images.

Figure 6. AZ58, in combination with chemotherapy, functions through decreased cellular proliferation and decreased microvessel density. (A) Immunohistochemistry with Ki-67 is displayed. Imaging was performed at 20 × magnification. Representative images are shown. (B) Positive Ki-67 nuclei were counted, averaged, and plotted on a bar graph. Error bars represent standard error. P values were calculated compared with the control condition. n = 10 images per treatment condition. (C) Immunohistochemistry using an antibody for CD-31 is displayed. Imaging was performed at 20 × magnification. Representative images are shown. (D) Positive foci of CD-31 were counted, averaged, and plotted on a bar graph. Error bars represent standard error. P values were calculated compared with the combination condition. n = 5 per treatment condition.
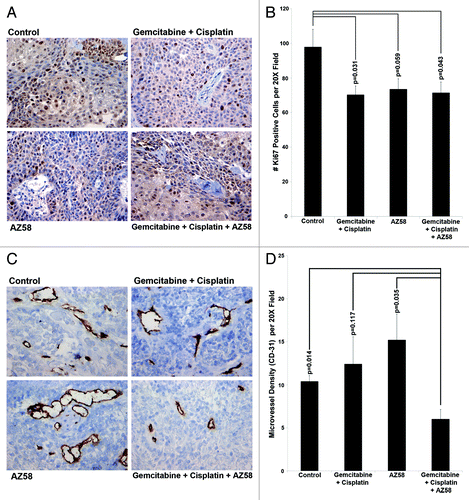
Figure 6. AZ58, in combination with chemotherapy, functions through decreased cellular proliferation and decreased microvessel density. (A) Immunohistochemistry with Ki-67 is displayed. Imaging was performed at 20 × magnification. Representative images are shown. (B) Positive Ki-67 nuclei were counted, averaged, and plotted on a bar graph. Error bars represent standard error. P values were calculated compared with the control condition. n = 10 images per treatment condition. (C) Immunohistochemistry using an antibody for CD-31 is displayed. Imaging was performed at 20 × magnification. Representative images are shown. (D) Positive foci of CD-31 were counted, averaged, and plotted on a bar graph. Error bars represent standard error. P values were calculated compared with the combination condition. n = 5 per treatment condition.

Figure 7. Cell death in UMUC-6 from AZ58 is mediated through a TNF-α-independent mechanism. (A) The effects on UMUC-6 of chemotherapy and AZ58 were not mitigated by the TNF-α blocking antibody. (B) Representative images of IHC for TNF-α demonstrate no difference in expression between treatment conditions. (C) Ennumeration with cell counting confirms the lack of a statistical difference in TNF-α expression.
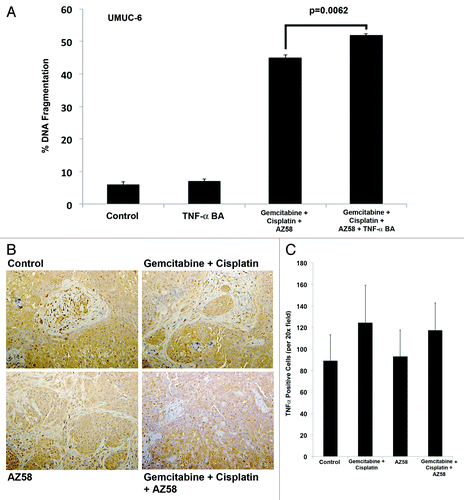
Figure 7. Cell death in UMUC-6 from AZ58 is mediated through a TNF-α-independent mechanism. (A) The effects on UMUC-6 of chemotherapy and AZ58 were not mitigated by the TNF-α blocking antibody. (B) Representative images of IHC for TNF-α demonstrate no difference in expression between treatment conditions. (C) Ennumeration with cell counting confirms the lack of a statistical difference in TNF-α expression.
Supplemental material

Additional material

Download Zip (148 KB)

Reprints and Corporate Permissions

Please note: Selecting permissions does not provide access to the full text of the article, please see our help page How do I view content?

To request a reprint or corporate permissions for this article, please click on the relevant link below:

Academic Permissions

Please note: Selecting permissions does not provide access to the full text of the article, please see our help page How do I view content?

Obtain permissions instantly via Rightslink by clicking on the button below:

If you are unable to obtain permissions via Rightslink, please complete and submit this Permissions form. For more information, please visit our Permissions help page.