Figures & data
Table 1. Clinical characteristics of activated Notch1 tissue specimens
Figure 1. Analysis of activated Notch1 expression in human GC tissues and cells. Immunohistochemical staining for activated Notch1 in gastric adenocarcinoma and their normal counterparts (n = 71) was detected using polyclonal antibody to human activated Notch1 (1:200 dilution). The results of immunohistochemical staining for activated Notch1 were scored and relative expression of activated Notch1 in 71 primary gastric cancer tissues compared with their pair-matched adjacent non-tumor tissues were illustrated (A). The histograms above the x-axis means positive expression of activated Notch1. The brown signals represent positive staining for activated Notch1 (original magnifications ×200) (B). Activated Notch1 expression levels in the cellular total protein were determined by western blotting. Each blot was stripped after being detected with activated Notch1 and reprobed with GAPDH to ensure equal protein loading (C). Band densities were normalized to GAPDH. Intensities of the immunoreactive bands were quantified by densitometric scanning.
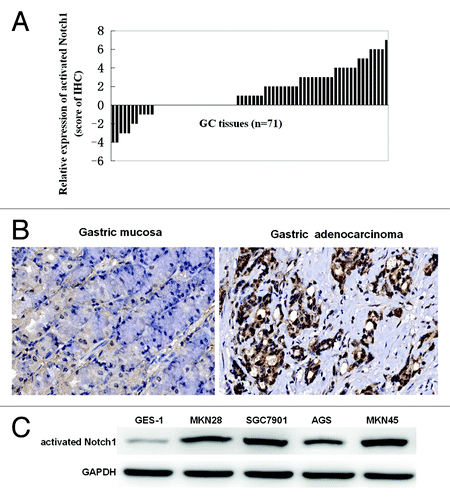
Figure 2. ERK1/2 activity in gastric cancer cell lines treated with DAPT in the presence or absence of the ERK inhibitor PD98059. SGC7901 and MKN45 cells treated with DAPT at 10 μM or PD98059 at 10 μM or DAPT-PD98059 combination for 24 h and analyzed by immunoblot with antibody for phosphorylated ERK1/2 (p-ERK1/2), total ERK1/2 (ERK1/2), activated Notch1, or GAPDH.
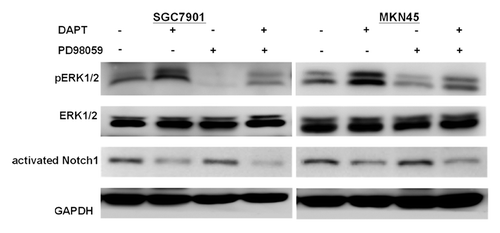
Figure 3. Inhibition of DAPT and PD98059 on SGC7901 and MKN45 cells proliferation. SGC7901 and MKN45 cells were cultured with 10 μM PD98059 and/or 10 μM DAPT for 24–72 h, cell proliferation was measured by MTS. Data represent the mean ± SE of three independent experiments and each experiment was performed in triplicate. 0.1% DMSO was used as control (*P < 0.05, **P < 0.01 vs. DMSO control cells; #P < 0.05, # #P < 0.01 vs. DAPT alone; $P < 0.05, $$P < 0.01 vs. PD98059 alone).
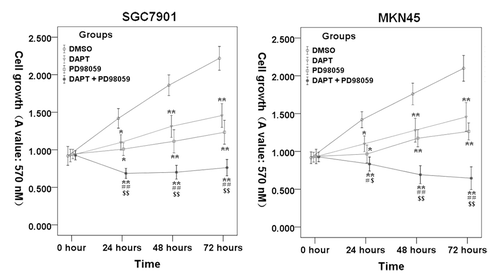
Figure 4. Effects of DAPT and/or PD98059 on apoptosis of SGC7901 and MKN45 cells. After cultured with DAPT (10 μM) and/or PD98059 (10 μM) for 24 h, cells were stained with Annexin V-PE/ 7-AAD and analyzed by flow cytometry. Lower left quadrants, viable cells. The numerical results represent the mean of triplicate plates (A and C) and a representative experiment is shown (B and D). Data represent the mean ± SE of three independent experiments and each experiment was performed in triplicate (*P < 0.05, **P < 0.01 vs. DMSO control cells; #P < 0.05, ##P < 0.01 vs. DAPT alone; $P < 0.05, $$P < 0.01 vs. PD98059 alone). Cells were treated with the appropriate drug combinations for 24 h, stained with DAPI and photographed (E and F).
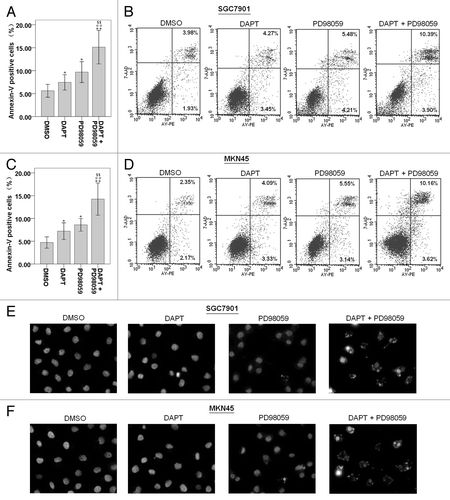
Figure 5. Effect of PD98059 on DAPT-induced change in related signaling protein levels. SGC7901 and MKN45 cells were treated with 10 μM DAPT and 10 μM PD98059 for 24 h. The levels of β-catenin, c-Myc, and cyclin D1 were analyzed by western blotting with their specific antibodies.
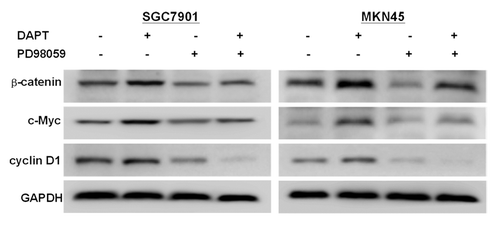
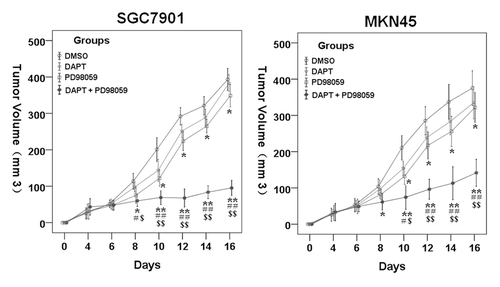
Figure 6. Therapeutic effects of treatments on the growth of tumor. Tumor sizes of all mice were assessed every 3 d according to the following formula: volume (mm3) = (width2 × length)/2. Compared with the control group and the 10 mg/kg DAPT or 10 mg/kg PD98059 group, the DAPT-PD98059 combining regimen significantly inhibits tumor growth. Data are mean ± SE of at least two independent experiments (*P < 0.05, **P < 0.01 vs. DMSO control cells; #P < 0.05, # #P < 0.01vs. DAPT alone; $P < 0.05 vs. PD98059 alone).