856
Views
12
CrossRef citations to date
0
Altmetric
Research Paper

Numbers and cytotoxicities of CD3+CD56+ T lymphocytes in peripheral blood of patients with acute myeloid leukemia and acute lymphocytic leukemia

, , , , , , & show all
Pages 916-921 | Received 31 Mar 2013, Accepted 29 Jul 2013, Published online: 05 Aug 2013

Figures & data

Table 1. Numbers of CD3+CD56+ T lymphocytes in the peripheral blood in patients with AML, ALL, CR-AML, CR-ALL, and in healthy controls

Figure 1. Levels and numbers of CD3+CD56+ T lymphocytes in the peripheral blood of patients with AL, CR-AL, and healthy controls. CD3+CD56+ T lymphocytes were significantly increased in AML and ALL patients compared with healthy controls, and levels recovered in AL patients who achieved CR. CD3+CD56+ T lymphocytes were also increased in AML patients with WBC counts >10 × 109/L and ALL patients with WBC counts <10 × 109/L. (A) CD3+CD56+ T lymphocytes. (B) Numbers in healthy controls, AML, ALL, CR-AML, and CR-ALL patients. (C) Numbers in healthy controls, AML-1, AML-2, ALL-1, and ALL-2 patients.
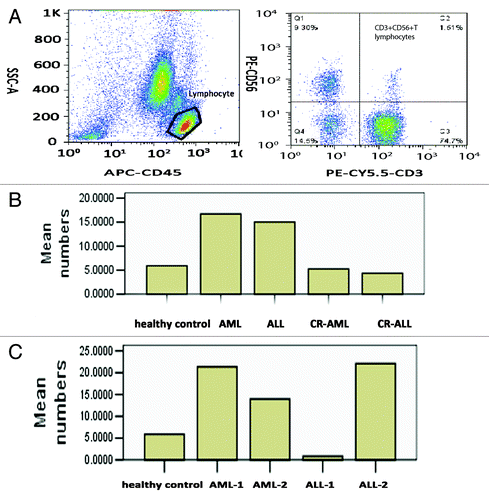
Figure 1. Levels and numbers of CD3+CD56+ T lymphocytes in the peripheral blood of patients with AL, CR-AL, and healthy controls. CD3+CD56+ T lymphocytes were significantly increased in AML and ALL patients compared with healthy controls, and levels recovered in AL patients who achieved CR. CD3+CD56+ T lymphocytes were also increased in AML patients with WBC counts >10 × 109/L and ALL patients with WBC counts <10 × 109/L. (A) CD3+CD56+ T lymphocytes. (B) Numbers in healthy controls, AML, ALL, CR-AML, and CR-ALL patients. (C) Numbers in healthy controls, AML-1, AML-2, ALL-1, and ALL-2 patients.

Table 2. Numbers of CD3+CD56+ T lymphocytes in the peripheral blood of patients with AML-1, ALL-1, AML-2, ALL-2, and in healthy controls

Table 3. Function of CD3+CD56+ T lymphocytes in the peripheral blood of patients with AML, ALL, CR-AML, CR-ALL, and healthy controls

Figure 2. Perforin expression in CD3+CD56+ T lymphocytes in the peripheral blood of patients with AL patient, CR-AL, and healthy controls in relation to WBC count. In each plot, the red peak represents the negative control for perforin, and the blue peak represents perforin expression in each group, respectively.Perforin expression levels in AML and ALL patients were lower than in healthy controls, and remained lower even after CR. Changes in WBC counts in AML and ALL patients had no effect on perforin expression. (A) Healthy controls, (B) AML-1, (C) AML-2; (D) ALL-1, (E) ALL-2, (F) CR-AML, (G) CR-ALL.
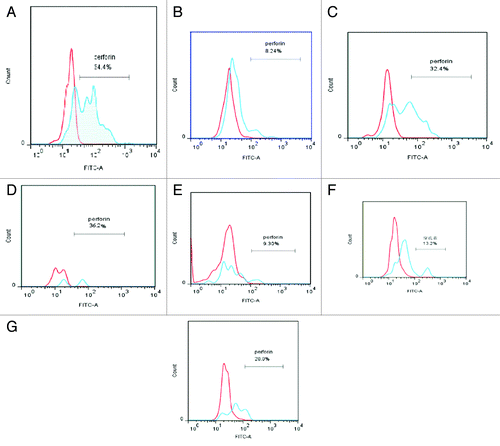
Figure 2. Perforin expression in CD3+CD56+ T lymphocytes in the peripheral blood of patients with AL patient, CR-AL, and healthy controls in relation to WBC count. In each plot, the red peak represents the negative control for perforin, and the blue peak represents perforin expression in each group, respectively.Perforin expression levels in AML and ALL patients were lower than in healthy controls, and remained lower even after CR. Changes in WBC counts in AML and ALL patients had no effect on perforin expression. (A) Healthy controls, (B) AML-1, (C) AML-2; (D) ALL-1, (E) ALL-2, (F) CR-AML, (G) CR-ALL.

Table 4. Function of CD3+CD56+ T lymphocytes in the peripheral blood of patients with AML and ALL in relation to WBC count at diagnosis

Table 5. Characteristics of AML/ALL and CR AML/ALL patients

Reprints and Corporate Permissions

Please note: Selecting permissions does not provide access to the full text of the article, please see our help page How do I view content?

To request a reprint or corporate permissions for this article, please click on the relevant link below:

Academic Permissions

Please note: Selecting permissions does not provide access to the full text of the article, please see our help page How do I view content?

Obtain permissions instantly via Rightslink by clicking on the button below:

If you are unable to obtain permissions via Rightslink, please complete and submit this Permissions form. For more information, please visit our Permissions help page.