Figures & data
Table 1. IC50s for cell viability assays (µM concentrations)
Figure 1. Effect of MK2206 plus carboplatinum (carbo) paclitaxel (Taxol) combinations on cell viability in three different gastric cancer cell lines: AGS, SNU-1, and SNU-16. The growth inhibition produced by titrated concentrations of MK2206 (blue lines; concentrations indicated on the bottom horizontal axis) and Carbo/Taxol (400:1 ratio) (red lines; concentrations indicated on top horizontal axis) is plotted against viability (% of untreated control). (A) Concurrent treatment (72 h) MK-2206 and Carbo/Taxol 1:8 ratio. (B) Sequential treatment; cells were treated with MK-2206 for 24 h then Carbo/Taxol combination was added for 48 h 1:8 ratio. (C) Sequential treatment; cells were treated with Carbo/Taxol for 24 h then MK-2206 was added for 48 h 1:2 ratio.
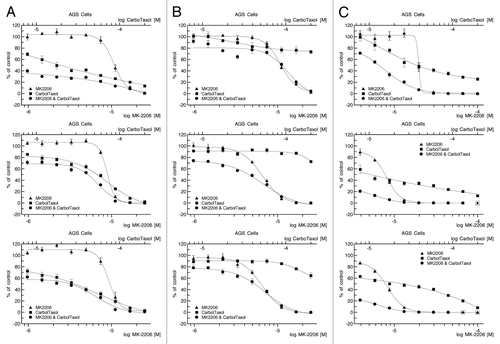
Table 2. MK-2206 and CarboTaxol concurrent treatment (72 h)
Table 3. Synergy result summary for cell viability assays. MK-2206 and Carbo/Taxol sequential treatment (1st drug 24 h, 2nd drug added for 48 h).
Figure 2. Effect of MK-2206 with and without chemotherapy on the PI3K pathways. Gastric cells were treated with carboplatinum/paclitaxel in the presence or absence of MK-2206. Cell lysates were prepared, and the levels of Akt and pAkt, were determined by western blot probed with the indicated antibodies. MDA-MB 468 cell lines were used as positive control.
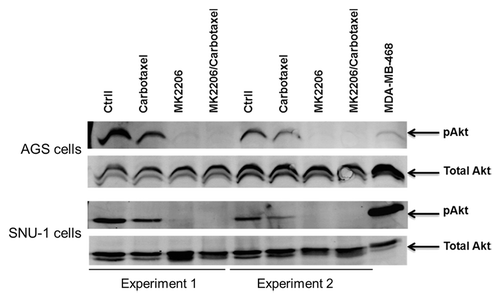
Figure 3. PARP cleavage analysis in AGS cells by western blotting with anti-PARP. PARP proenzyme (116 kD) and cleaved subunit (85 kD) are indicated. AGS cell treated with MK-2206 and chemotherapy showed higher cleaved/uncleaved PARP.
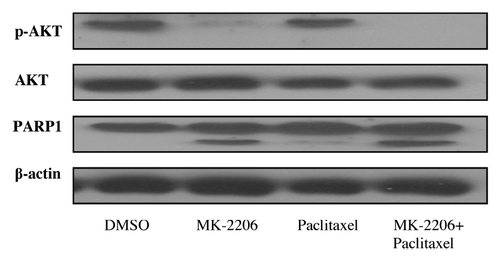
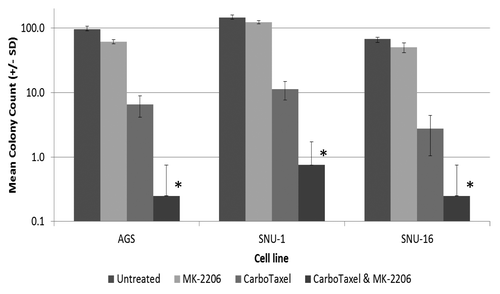
Figure 4. MK-2206 synergizes with CarboTaxol in reducing anchorage-independent growth in three gastric cancer cell lines. AGS cells treated with 100 µM MK-2206, 100 nM CarboTaxol (1000:1 molar ratio of carboplatinum and paclitaxel respectively) or combination for 2 weeks. MK-2206 was re-dosed twice weekly. *The CarboTaxol and MK-2206 combination significantly reduced colony counts relative to CarboTaxol alone (unpaired t test P values were 0.002, 0.001, and 0.03 for AGS, SNU-1, and SNU-16 cell lines, respectively).