959
Views
17
CrossRef citations to date
0
Altmetric
Research Paper

A model of sensitivity and resistance to histone deacetylase inhibitors in diffuse large B cell lymphoma

Role of cyclin-dependent kinase inhibitors

, , , , , , , & show all
Pages 949-961 | Received 24 Apr 2013, Accepted 29 Jul 2013, Published online: 02 Aug 2013

Figures & data

Table 1. IC50 concentrations for growth inhibition at 24 h PXD101 treatment as determined by MTS assay

Figure 1. The cytotoxic response to PXD101. DB (A and B), OCI-Ly19 (C and D), and SUDHL6 (E and F) cells were treated with PXD101 at the IC50 concentrations determined for each as shown in . At 0, 24, 48, and 72 h treatment cells were harvested and subjected to Annexin V/PI assay (A, C, and E) or cell cycle analysis (B, D, and F). The graphs shown represent the results of 3–4 independent experiments. Error bars represent SEM.
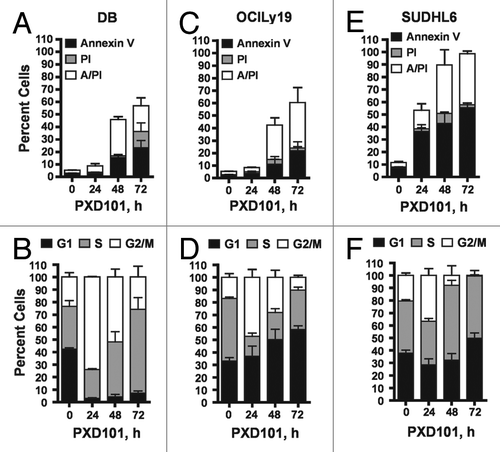
Figure 1. The cytotoxic response to PXD101. DB (A and B), OCI-Ly19 (C and D), and SUDHL6 (E and F) cells were treated with PXD101 at the IC50 concentrations determined for each as shown in Table 1. At 0, 24, 48, and 72 h treatment cells were harvested and subjected to Annexin V/PI assay (A, C, and E) or cell cycle analysis (B, D, and F). The graphs shown represent the results of 3–4 independent experiments. Error bars represent SEM.
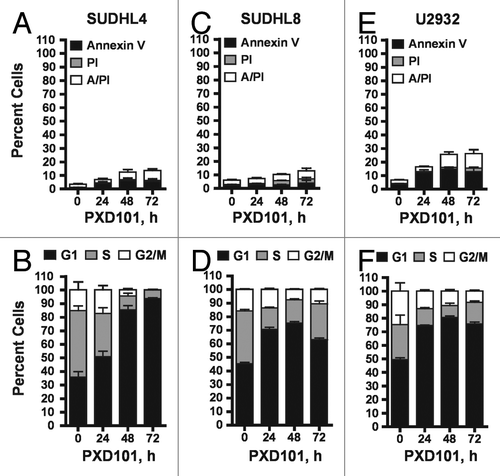
Figure 2. The cytostatic response to PXD101. SUDHL4 (A and B), SUDHL8 (C and D), and U2932 (E and F) cells were treated with PXD101 at the IC50 concentrations determined for each as shown in . At 0, 24, 48, and 72 h treatment cells were harvested and subjected to Annexin V/PI assay (A, C, and E) or cell cycle analysis (B, D, and F). The graphs shown represent the results of 3–4 independent experiments. Error bars represent SEM.

Figure 2. The cytostatic response to PXD101. SUDHL4 (A and B), SUDHL8 (C and D), and U2932 (E and F) cells were treated with PXD101 at the IC50 concentrations determined for each as shown in Table 1. At 0, 24, 48, and 72 h treatment cells were harvested and subjected to Annexin V/PI assay (A, C, and E) or cell cycle analysis (B, D, and F). The graphs shown represent the results of 3–4 independent experiments. Error bars represent SEM.

Figure 3. Reversibility of PXD101 responses. (A and B) DB (A) or OCI-Ly19 (B) cells were treated at their respective IC50 concentrations for 0, 2, 4, 8, or 24 h after which the cells were washed and resuspended in fresh medium without drug. After 24 h further incubation, the cells were harvested and subjected to Annexin V/PI assay. (C–F) SUDHL4 (C), U2932 (D), and SUDHL8 (E) were treated with either DMSO or PXD101 (at IC50 concentrations) for 48 h. Cells were then washed and incubated in drug-free medium for a further 0, 24, 48, or 72 h. The cells were harvested and subjected to cell cycle analysis. The graphs shown represent the results of 3–4 independent experiments. Error bars represent SEM.
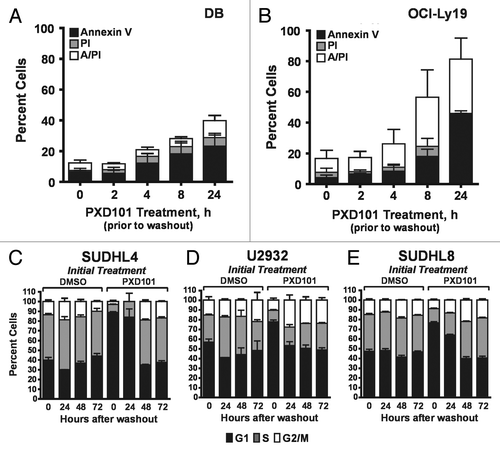
Figure 3. Reversibility of PXD101 responses. (A and B) DB (A) or OCI-Ly19 (B) cells were treated at their respective IC50 concentrations for 0, 2, 4, 8, or 24 h after which the cells were washed and resuspended in fresh medium without drug. After 24 h further incubation, the cells were harvested and subjected to Annexin V/PI assay. (C–F) SUDHL4 (C), U2932 (D), and SUDHL8 (E) were treated with either DMSO or PXD101 (at IC50 concentrations) for 48 h. Cells were then washed and incubated in drug-free medium for a further 0, 24, 48, or 72 h. The cells were harvested and subjected to cell cycle analysis. The graphs shown represent the results of 3–4 independent experiments. Error bars represent SEM.

Figure 4. Sensitivity or resistance to PXD101 is not correlated with expression of MYC or BCL2. (A–C) Whole cell extracts were generated from the cell lines shown in 2–3 independent experiments. Equal amounts of protein were separated by SDS-PAGE and subjected to western transfer and immunoblotting with c-myc, BCL2, or GAPDH antibodies. All of the samples shown were run on the same SDS-PAGE gel and blotted simultaneously to accurately measure relative levels of each protein. The results of analysis are shown graphically for c-myc (B) and BCL2 (C). Levels of each protein are expressed relative to those in Exp. One of OCI-Ly19 cells. (D) Cells were treated with PXD101 for the times shown. Whole cell extracts were generated and equal amounts of protein were separated by SDS-PAGE, and subjected to Western transfer and immunoblotting with MYC, BCL2, or GAPDH antibodies. BCL2 shown for SUDHL8 correspond to the species with altered mobility as shown in (A). The results shown are representative of three independent experiments.
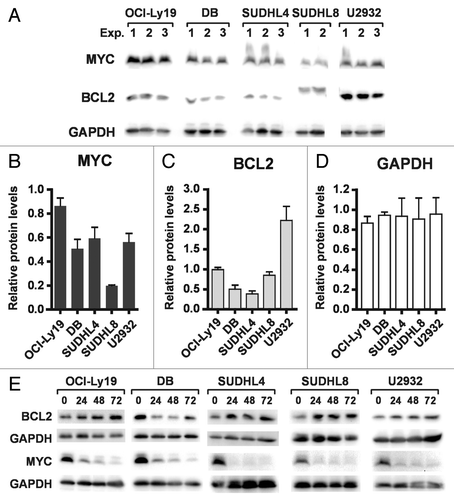
Figure 4. Sensitivity or resistance to PXD101 is not correlated with expression of MYC or BCL2. (A–C) Whole cell extracts were generated from the cell lines shown in 2–3 independent experiments. Equal amounts of protein were separated by SDS-PAGE and subjected to western transfer and immunoblotting with c-myc, BCL2, or GAPDH antibodies. All of the samples shown were run on the same SDS-PAGE gel and blotted simultaneously to accurately measure relative levels of each protein. The results of analysis are shown graphically for c-myc (B) and BCL2 (C). Levels of each protein are expressed relative to those in Exp. One of OCI-Ly19 cells. (D) Cells were treated with PXD101 for the times shown. Whole cell extracts were generated and equal amounts of protein were separated by SDS-PAGE, and subjected to Western transfer and immunoblotting with MYC, BCL2, or GAPDH antibodies. BCL2 shown for SUDHL8 correspond to the species with altered mobility as shown in (A). The results shown are representative of three independent experiments.

Figure 5. PXD101 treatment induces loss of Rb protein and Rb phosphorylation. (A and B) The cell lines shown were treated with PXD101 for up to 72 h. (A) Whole cell extracts were subjected to western blotting with antibodies against total Rb protein or α-tubulin. (B) Total RNA was extracted from cells and used to measure levels of Rb mRNA by RT-qPCR. (C and D) Whole cell extracts from PXD101-treated SUDHL4 (C) or SUDHL8 (D) cells were subjected to western blotting with antibodies against Rb phosphorylated at either Ser780 or Ser795, hypophosphorylated Rb, or α-tubulin. (E and F) Levels of total Rb, pRb Ser780, and pRb Ser795 were quantitated from non-saturated images and normalized to levels of α-tubulin for SUDHL4 (E) and SUDHL8 (F) cells. Normalized values from each timepoint of PXD101 treatment are expressed as fractions or multiples of the normalized value from untreated cells for each individual experiment. All of the results shown are representative of 2–4 independent experiments.
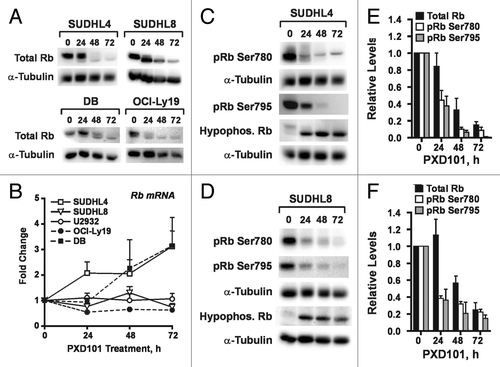
Figure 5. PXD101 treatment induces loss of Rb protein and Rb phosphorylation. (A and B) The cell lines shown were treated with PXD101 for up to 72 h. (A) Whole cell extracts were subjected to western blotting with antibodies against total Rb protein or α-tubulin. (B) Total RNA was extracted from cells and used to measure levels of Rb mRNA by RT-qPCR. (C and D) Whole cell extracts from PXD101-treated SUDHL4 (C) or SUDHL8 (D) cells were subjected to western blotting with antibodies against Rb phosphorylated at either Ser780 or Ser795, hypophosphorylated Rb, or α-tubulin. (E and F) Levels of total Rb, pRb Ser780, and pRb Ser795 were quantitated from non-saturated images and normalized to levels of α-tubulin for SUDHL4 (E) and SUDHL8 (F) cells. Normalized values from each timepoint of PXD101 treatment are expressed as fractions or multiples of the normalized value from untreated cells for each individual experiment. All of the results shown are representative of 2–4 independent experiments.

Figure 6. Differential effects of PXD101 on activity of cyclin E/cdk2. Whole cell extracts from cells treated with PXD101 for 0, 8, 24, and 48 h were used to perform immunoprecipitation with cyclin E antibody. (A) Bound fractions were subjected to kinase assay with purified histone H1 as substrate. Roscovitine was added to one sample to ensure that the labeling detected was due to the activity of cyclin-dependent kinases. Following SDS-PAGE, gels were dried and exposed to phosphorimaging screens to visualize radiolabeled protein. Representative results from 3 independent experiments in each cell line. (B) Graphical summary of results from 3–4 independent replicates of IP-kinase assays. (*P < 0.05, **P < 0.01).
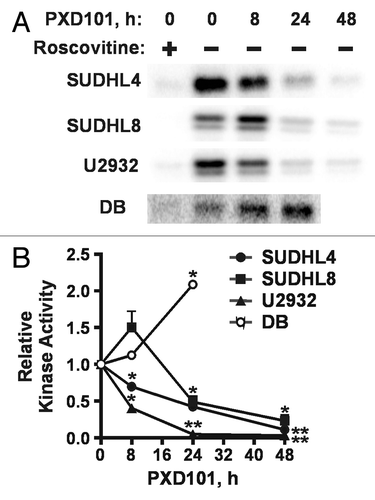
Figure 6. Differential effects of PXD101 on activity of cyclin E/cdk2. Whole cell extracts from cells treated with PXD101 for 0, 8, 24, and 48 h were used to perform immunoprecipitation with cyclin E antibody. (A) Bound fractions were subjected to kinase assay with purified histone H1 as substrate. Roscovitine was added to one sample to ensure that the labeling detected was due to the activity of cyclin-dependent kinases. Following SDS-PAGE, gels were dried and exposed to phosphorimaging screens to visualize radiolabeled protein. Representative results from 3 independent experiments in each cell line. (B) Graphical summary of results from 3–4 independent replicates of IP-kinase assays. (*P < 0.05, **P < 0.01).

Figure 7. PXD101 effects on expression of cyclin-dependent kinase inhibitors (CKI) p21 and p27 and modification of p53. (A and B) The cell lines shown were treated with PXD101 for 0, 2, 4, 8, 24, 48, and 72 h. Whole cell extracts were generated and subjected to western blotting with antibodies against p21, p27, hsp90, α-tubulin, or GAPDH. PXD101-resistant cell lines are shown in (A) while PXD101-sensitive cell lines are shown in (B). (C and D) Cells were treated with PXD101 (P), doxorubicin (2 μM) (D), or Nutlin-3A (10 or 20 μM) (N) for 8 or 24 h. Whole cell extracts from treated and untreated cells were generated and subjected to western blotting with the antibodies indicated. PXD101-resistant cell lines are shown in (C) while PXD101-sensitive cell lines are shown in (D). The blots shown are representative of 3 independent experiments.
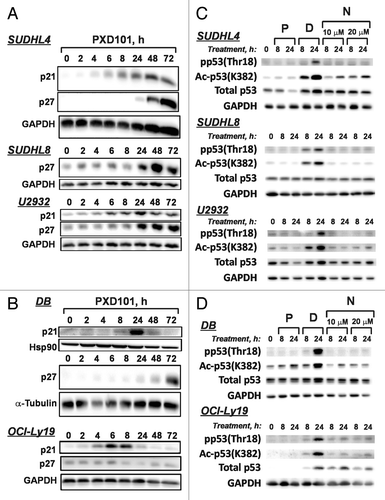
Figure 7. PXD101 effects on expression of cyclin-dependent kinase inhibitors (CKI) p21 and p27 and modification of p53. (A and B) The cell lines shown were treated with PXD101 for 0, 2, 4, 8, 24, 48, and 72 h. Whole cell extracts were generated and subjected to western blotting with antibodies against p21, p27, hsp90, α-tubulin, or GAPDH. PXD101-resistant cell lines are shown in (A) while PXD101-sensitive cell lines are shown in (B). (C and D) Cells were treated with PXD101 (P), doxorubicin (2 μM) (D), or Nutlin-3A (10 or 20 μM) (N) for 8 or 24 h. Whole cell extracts from treated and untreated cells were generated and subjected to western blotting with the antibodies indicated. PXD101-resistant cell lines are shown in (C) while PXD101-sensitive cell lines are shown in (D). The blots shown are representative of 3 independent experiments.

Figure 8. PXD101 induces association of CKI with cyclin E/cdk2 in resistant DLBCL cell lines. Whole cell extracts from cells treated with PXD101 for 0, 8, 24, and 48 h were used to perform immunoprecipitation with cyclin E antibody. Bound fractions were subjected to western blotting with antibodies against cyclin E and cdk2, and either p21 or p27. The results shown are representative of 3–4 independent experiments.
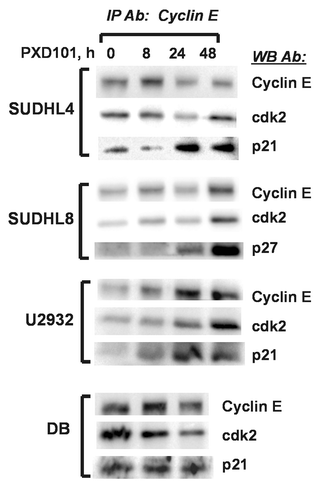
Figure 8. PXD101 induces association of CKI with cyclin E/cdk2 in resistant DLBCL cell lines. Whole cell extracts from cells treated with PXD101 for 0, 8, 24, and 48 h were used to perform immunoprecipitation with cyclin E antibody. Bound fractions were subjected to western blotting with antibodies against cyclin E and cdk2, and either p21 or p27. The results shown are representative of 3–4 independent experiments.
Supplemental material

Additional material

Download Zip (217.5 KB)