883
Views
12
CrossRef citations to date
0
Altmetric
Research Paper

In human retinoblastoma Y79 cells okadaic acid–parthenolide co-treatment induces synergistic apoptotic effects, with PTEN as a key player

, , , , , , , & show all
Pages 922-931 | Received 08 May 2013, Accepted 29 Jul 2013, Published online: 12 Aug 2013

Figures & data

Figure 1. Synergistic interaction of OKA and PN in human retinoblastoma Y79 cells. The figure describes the time-and dose-dependent effects of OKA and PN treatment (A) and the effects of their combination (B) analyzed by MTT assay. Data are the mean ± SD of three independent experiments, each performed in triplicate, and expressed as percentage of the control. Data were considered significant at *P < 0.05 and highly significant at #P < 0.01 as compared with the control group. (C) Values of combination index (CI) were calculated in relation to the fraction affected (Fa). Values of CI less than 1.0 indicate synergistic interactions between the two drugs.
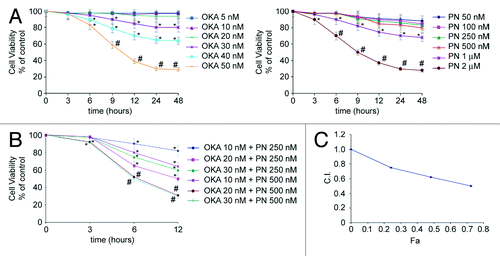
Figure 1. Synergistic interaction of OKA and PN in human retinoblastoma Y79 cells. The figure describes the time-and dose-dependent effects of OKA and PN treatment (A) and the effects of their combination (B) analyzed by MTT assay. Data are the mean ± SD of three independent experiments, each performed in triplicate, and expressed as percentage of the control. Data were considered significant at *P < 0.05 and highly significant at #P < 0.01 as compared with the control group. (C) Values of combination index (CI) were calculated in relation to the fraction affected (Fa). Values of CI less than 1.0 indicate synergistic interactions between the two drugs.

Figure 2. Apoptotic effects induced by OKA/PN combination in human retinoblastoma Y79 cells. The figure describes the effects OKA and PN treatment on cell morphology analyzed by (A) phase contrast (PC) microscopy, (B) fluorescence microscopy by Hoechst 33258 (H) staining, (C) fluorescence microscopy by acridine orange/ethidium bromide (A/E) staining. (Original magnification 400×.) Images are representative of at least four independent experiments.
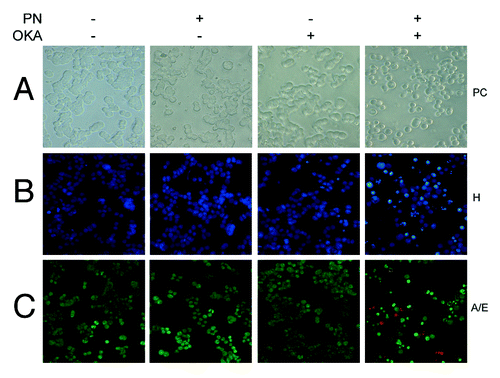
Figure 2. Apoptotic effects induced by OKA/PN combination in human retinoblastoma Y79 cells. The figure describes the effects OKA and PN treatment on cell morphology analyzed by (A) phase contrast (PC) microscopy, (B) fluorescence microscopy by Hoechst 33258 (H) staining, (C) fluorescence microscopy by acridine orange/ethidium bromide (A/E) staining. (Original magnification 400×.) Images are representative of at least four independent experiments.

Figure 3. OKA/PN treatment induces apoptosis and activation of caspases in human retinoblastoma Y79 cells. (A) Graph summarizing percentages of cells in sub-G0-G1 phase, evaluated by flow cytometric analysis of propidium iodide DNA staining. Data are the mean ± SD of three independent experiments, each performed in triplicate. Data were considered significant at *P < 0.05 and highly significant at #P < 0.01 as compared with the control group. (B) Cell cycle profile at 6 h after OKA, PN, and OKA/PN treatment. (C) Graph summarizing percentages of early apoptotic cells (Annexin V+/PI) measured by flow cytometric analysis of Annexin V labeling. Data are the mean ± SD of three independent experiments, each performed in triplicate. Data were considered significant at #P < 0.01 as compared with the control group. (D) Typical contour plots at 6 h after OKA, PN and OKA/PN treatment. (E) Western blot analysis of apoptotic markers. Actin was used as the loading control. Images are representative of at least four independent experiments.
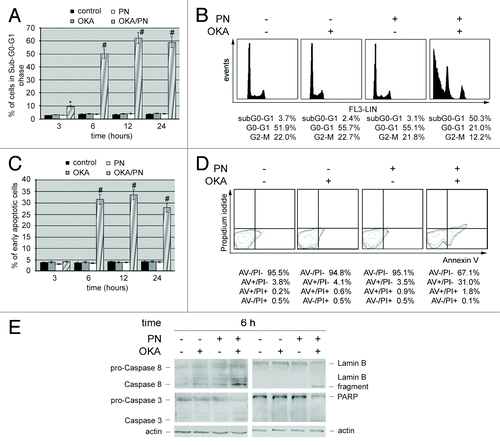
Figure 3. OKA/PN treatment induces apoptosis and activation of caspases in human retinoblastoma Y79 cells. (A) Graph summarizing percentages of cells in sub-G0-G1 phase, evaluated by flow cytometric analysis of propidium iodide DNA staining. Data are the mean ± SD of three independent experiments, each performed in triplicate. Data were considered significant at *P < 0.05 and highly significant at #P < 0.01 as compared with the control group. (B) Cell cycle profile at 6 h after OKA, PN, and OKA/PN treatment. (C) Graph summarizing percentages of early apoptotic cells (Annexin V+/PI−) measured by flow cytometric analysis of Annexin V labeling. Data are the mean ± SD of three independent experiments, each performed in triplicate. Data were considered significant at #P < 0.01 as compared with the control group. (D) Typical contour plots at 6 h after OKA, PN and OKA/PN treatment. (E) Western blot analysis of apoptotic markers. Actin was used as the loading control. Images are representative of at least four independent experiments.

Figure 4. OKA/PN induces ROS generation and depletion of intracellular GSH. (A) Graph shows ROS generation measured by flow cytometry as described in materials and methods. Data are the mean ± SD of three independent experiments, each performed in triplicate. Data were considered significant at *P < 0.05 and highly significant at #P < 0.01 as compared with the control group. (B) The figure shows the shift of fluorescence intensity, observed at 6 h after OKA/PN treatment and indicating a potent increase in ROS level. (C) The graph shows the induced depletion of intracellular GSH measured by the colorimetric assay reported in materials and methods. Data are the mean ± SD of three independent experiments, each performed in triplicate. Data were considered significant at *P < 0.05 and highly significant at #P < 0.01 as compared with the control group. (D) The figure shows the effect of pre-treatment with BSO on sensitivity to OKA/PN. Data are the mean ± SD of three independent experiments, each performed in triplicate. Data were considered significant at *P < 0.05 as compared with the control group.
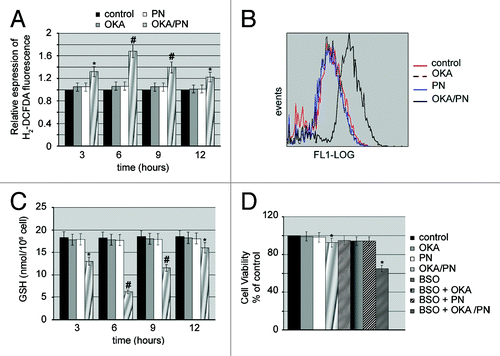
Figure 4. OKA/PN induces ROS generation and depletion of intracellular GSH. (A) Graph shows ROS generation measured by flow cytometry as described in materials and methods. Data are the mean ± SD of three independent experiments, each performed in triplicate. Data were considered significant at *P < 0.05 and highly significant at #P < 0.01 as compared with the control group. (B) The figure shows the shift of fluorescence intensity, observed at 6 h after OKA/PN treatment and indicating a potent increase in ROS level. (C) The graph shows the induced depletion of intracellular GSH measured by the colorimetric assay reported in materials and methods. Data are the mean ± SD of three independent experiments, each performed in triplicate. Data were considered significant at *P < 0.05 and highly significant at #P < 0.01 as compared with the control group. (D) The figure shows the effect of pre-treatment with BSO on sensitivity to OKA/PN. Data are the mean ± SD of three independent experiments, each performed in triplicate. Data were considered significant at *P < 0.05 as compared with the control group.

Figure 5. Effects of OKA/PN treatment on PTEN/Akt/Mdm2/p53 pathway. (A and B) describe western blotting analyses after 6 h of drugs treatment. Actin was used as the loading control. Images are representative of at least four independent experiments. (C) The effect of 6 h of drugs treatment on p53 localization by fluorescence microscopy. Cells were triple stained with (1) Hoechst 33258 dye (blue), to localize the nucleus; (2) rhodamine-conjugated secondary antibody (red) to localize cytosolic actin; (3) FITC-conjugated secondary antibody (green) to localize cytosolic/nuclear p53. The right panels show the merge of the three dyes. (Original magnification 400×.) Images are representative of at least four independent experiments.
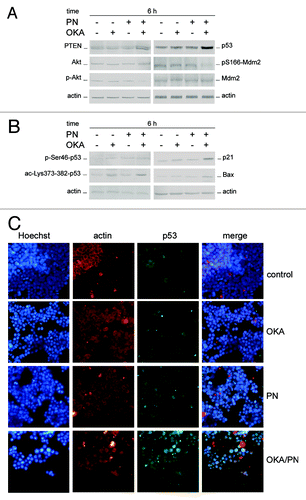
Figure 5. Effects of OKA/PN treatment on PTEN/Akt/Mdm2/p53 pathway. (A and B) describe western blotting analyses after 6 h of drugs treatment. Actin was used as the loading control. Images are representative of at least four independent experiments. (C) The effect of 6 h of drugs treatment on p53 localization by fluorescence microscopy. Cells were triple stained with (1) Hoechst 33258 dye (blue), to localize the nucleus; (2) rhodamine-conjugated secondary antibody (red) to localize cytosolic actin; (3) FITC-conjugated secondary antibody (green) to localize cytosolic/nuclear p53. The right panels show the merge of the three dyes. (Original magnification 400×.) Images are representative of at least four independent experiments.

Figure 6. Effects of silencing PTEN gene on the molecular players which control apoptosis. Western blot analysis of (A) knockdown efficiency of PTEN protein, and (B) of 6 h of drugs treatment on both untransfected cells and PTEN-siRNA or scrambled siRNA (Scr-siRNA) transfected cells. Actin was used as the loading control. Images are representative of at least four independent experiments. (C) Effects of 6 and 12 h of OKA/PN treatment on both GSH content (left) and cell viability (right) under the conditions described in (B). Data are the mean ± SD of three independent experiments, each performed in triplicate. Data were considered significant at *P < 0.05 and highly significant at #P < 0.01 as compared with Scr-siRNA transfected cells.
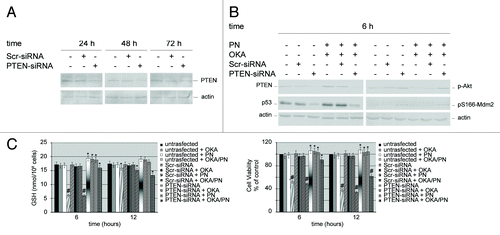
Figure 6. Effects of silencing PTEN gene on the molecular players which control apoptosis. Western blot analysis of (A) knockdown efficiency of PTEN protein, and (B) of 6 h of drugs treatment on both untransfected cells and PTEN-siRNA or scrambled siRNA (Scr-siRNA) transfected cells. Actin was used as the loading control. Images are representative of at least four independent experiments. (C) Effects of 6 and 12 h of OKA/PN treatment on both GSH content (left) and cell viability (right) under the conditions described in (B). Data are the mean ± SD of three independent experiments, each performed in triplicate. Data were considered significant at *P < 0.05 and highly significant at #P < 0.01 as compared with Scr-siRNA transfected cells.
Supplemental material

Additional material

Download Zip (75.9 KB)

Reprints and Corporate Permissions

Please note: Selecting permissions does not provide access to the full text of the article, please see our help page How do I view content?

To request a reprint or corporate permissions for this article, please click on the relevant link below:

Academic Permissions

Please note: Selecting permissions does not provide access to the full text of the article, please see our help page How do I view content?

Obtain permissions instantly via Rightslink by clicking on the button below:

If you are unable to obtain permissions via Rightslink, please complete and submit this Permissions form. For more information, please visit our Permissions help page.