Figures & data
Figure 1. Microscopic examination of Aff800 (50 nM), Pan800 (10 nM), and EGF800 (50 nM) binding and uptake by F98-EGFR (A) and F98-vIII (B) cells. DAPI was used to stain the nuclei. Scale bar: 10 μm.
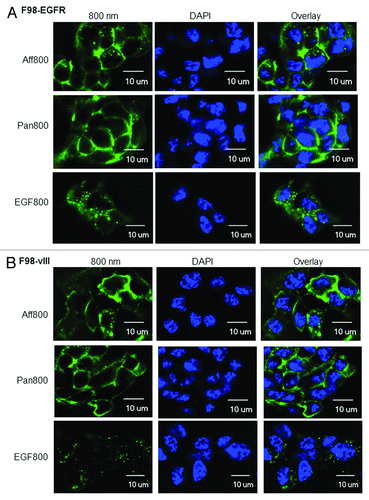
Figure 2. Concentration-dependent binding and uptake of different probes. Different concentrations of Aff800, Pan800, EGF800 and free IRDye 800CW (IR800) were incubated with F98-EGFR (A), F98-vIII (B), and F98-p (C). The fluorescence signals were determined after removal of unbound probes (n = 3 for each data point).
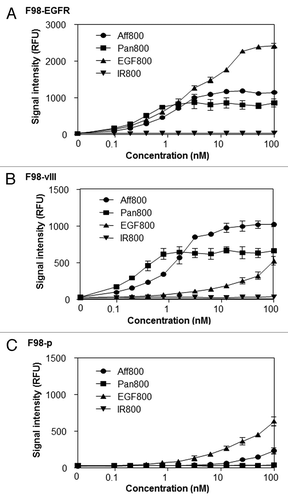
Figure 3. Competition of Aff800, Pan800, and EGF800 binding by unlabeled molecules. Aff800 (A and B), Pan800 (C and D), and EGF800 (E and F) were incubated with F98-EGFR and F98-vIII in the presence of different concentrations (ranging from 0.49 to 500 nM) of unlabeled nanobody 7D12, affibody, EGF, or panitumumab. The fluorescence signals were determined after removal of unbound probes (n = 3 for each data point).
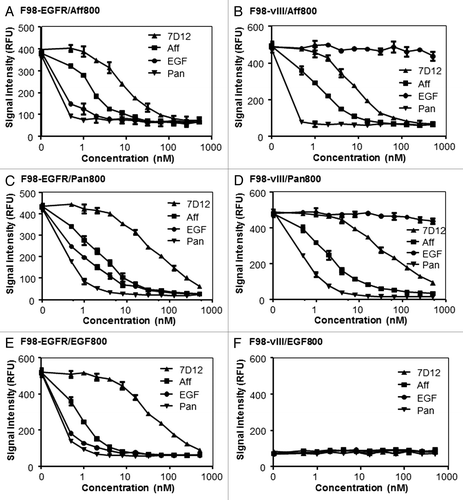
Figure 4. Optical imaging of mice bearing F98-p, F98-EGFR, and F98-vIII xenograft tumors. (A) Representative whole mouse images (dorsal view) acquired at 24 h after administration of Aff800 (left), Pan800 (center), and EGF800 (right). The white arrows indicate the tumors: 1, F98-p; 2, F98-EGFR; 3, F98-vIII. The red arrow heads indicate kidneys. Kidneys of Pan800-injected mouse were not marked as they were not visible. Note that the scales for fluorescence signal intensities are adjusted individually for each probe. (B) Ex vivo imaging of tissue distribution of mice injected with Aff800 (upper left), Pan800 (upper right), and EGF800 (lower left). The layout of different tissues is illustrated in the lower right corner.
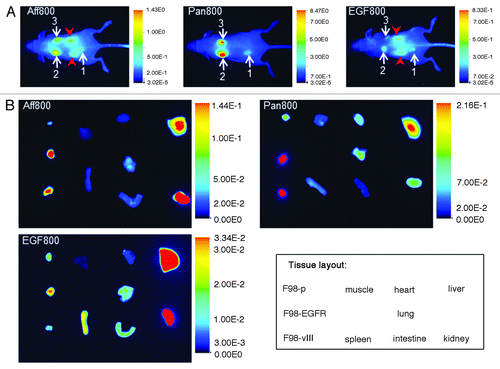
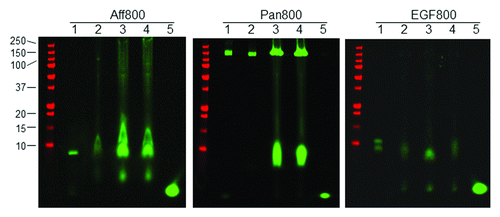
Figure 5. Analysis of tumor tissue lysates. Tumor tissue samples from mice injected with Aff800 (left), Pan800 (center), and EGF800 (right) were homogenized in RIPA buffer and analyzed on a non-reducing BIS-TRIS gel. F98-p, F98-EGFR, and F98-vIII tumor lysates (lanes 2, 3, and 4) were run on the gel together with the respective pure imaging agent (lane 1) and free dye IRDye 800CW (lane 5). The protein marker was shown on the left side (molecular weights in kDa from top to bottom: 250, 150, 100, 75, 50, 37, 25, 20, 15, 10).