1,185
Views
26
CrossRef citations to date
0
Altmetric
Research Paper

Differentiation of glioblastoma multiforme stem-like cells leads to downregulation of EGFR and EGFRvIII and decreased tumorigenic and stem-like cell potential

, , &
Pages 216-224 | Received 18 Sep 2013, Accepted 07 Oct 2013, Published online: 01 Nov 2013

Figures & data

Figure 1. GBM neurosphere cells can be induced to differentiate in vitro. (A) GBM neurosphere cells grow with a differentiated morphology upon serum exposure. Scale bar shows 100 µm. (B) GFAP mRNA is upregulated in GBM neurosphere cells when grown in serum containing media. (C) RA induces upregulation of GFAP mRNA in GBM neurosphere cells. Q-RT-PCR reactions are presented as mean mRNA expression ± SD. Statistical significance was calculated using the Student two-sided t test. ***P < 0.005. (D) GFAP and β-III-tubulin protein are upregulated after exposure to serum or RA.
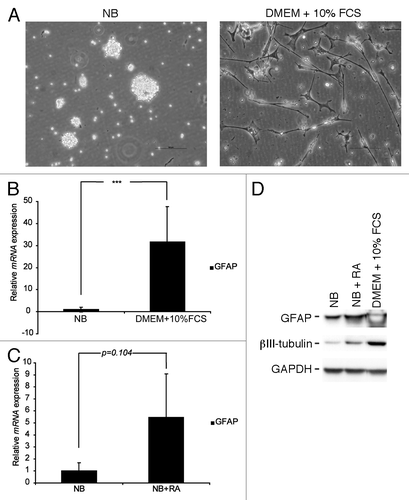
Figure 1. GBM neurosphere cells can be induced to differentiate in vitro. (A) GBM neurosphere cells grow with a differentiated morphology upon serum exposure. Scale bar shows 100 µm. (B) GFAP mRNA is upregulated in GBM neurosphere cells when grown in serum containing media. (C) RA induces upregulation of GFAP mRNA in GBM neurosphere cells. Q-RT-PCR reactions are presented as mean mRNA expression ± SD. Statistical significance was calculated using the Student two-sided t test. ***P < 0.005. (D) GFAP and β-III-tubulin protein are upregulated after exposure to serum or RA.

Figure 2. EGFR and EGFRvIII are downregulated in GBM neurosphere cells upon differentiation. Q-RT-PCR analyses showing downregulation of EGFR and EGFRvIII mRNA in GBM neurosphere cells upon (A) serum exposure and (B) RA treatment. Q-RT-PCR reactions are presented as mean mRNA expression ± SD. Statistical significance was calculated using the Student two-sided t test. ***P < 0.005 and **P < 0.01. (C) WB showing downregulation of EGFR and EGFRvIII protein after exposure to serum or RA.
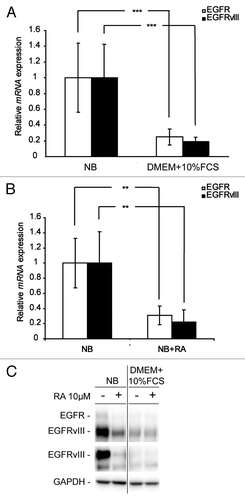
Figure 2. EGFR and EGFRvIII are downregulated in GBM neurosphere cells upon differentiation. Q-RT-PCR analyses showing downregulation of EGFR and EGFRvIII mRNA in GBM neurosphere cells upon (A) serum exposure and (B) RA treatment. Q-RT-PCR reactions are presented as mean mRNA expression ± SD. Statistical significance was calculated using the Student two-sided t test. ***P < 0.005 and **P < 0.01. (C) WB showing downregulation of EGFR and EGFRvIII protein after exposure to serum or RA.

Figure 3. Abrogation of EGFR signaling with the TKI AG1478 reduces cell viability and leads to induced differentiation. (A) WB showing reduced phosphorylation of EGFR upon AG1478 treatment. (B) AG1478 (10 µM) exposure leads to a decrease in the number of viable cells as measured by MTT. MTT results are presented as mean ± SD . Statistical significance was calculated using the Student two-sided t test. ***P < 0.005 and **P < 0.01. (C) Photographs of GBM neurospheres showing reduced sphere size upon AG1478 treatment. Scale bar shows 100 µm. (D) GFAP, β-III-tubulin, and CNPase protein is upregulated in a concentration-dependent manner upon AG1478 exposure.
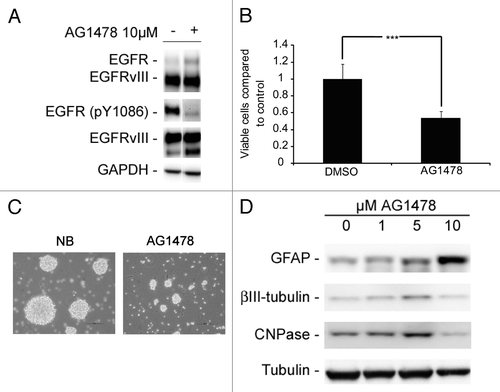
Figure 3. Abrogation of EGFR signaling with the TKI AG1478 reduces cell viability and leads to induced differentiation. (A) WB showing reduced phosphorylation of EGFR upon AG1478 treatment. (B) AG1478 (10 µM) exposure leads to a decrease in the number of viable cells as measured by MTT. MTT results are presented as mean ± SD . Statistical significance was calculated using the Student two-sided t test. ***P < 0.005 and **P < 0.01. (C) Photographs of GBM neurospheres showing reduced sphere size upon AG1478 treatment. Scale bar shows 100 µm. (D) GFAP, β-III-tubulin, and CNPase protein is upregulated in a concentration-dependent manner upon AG1478 exposure.

Figure 4. GBM neurosphere tumorigenicity and stem cell-like potential is reduced upon induced differentiation and after EGFR inhibition. (A) Soft agar assay showing reduced colony formation after induced differentiation or AG1478 treatment. Data are presented as mean ± SD of two independent experiments performed in duplicates. (B) Representative pictures of soft agar assay using either NB media or DMEM + 10% FCS. (C) Sub-sphere assay showing reduced sphere forming potential after pre-treatment with serum (DMEM + 10% FCS), RA, or AG1478 as compared with spheres formed in NB media only. Data presented are from one out of two independent experiments performed in sextuplicates and are presented as mean number of spheres ± SD. (D) WB showing downregulation of Nestin expression after exposure to serum (DMEM+10%FCS) or inhibition of EGFR signaling with AG1478. (E) Primary sphere formation is reduced upon abrogation of EGFR signaling with AG1478. Data are presented as mean number of spheres ± SD. Statistical significance was calculated between treated and corresponding control, if not indicated otherwise, using the Student two-sided t test. ***P < 0.005, **P < 0.01, and *P < 0.05.
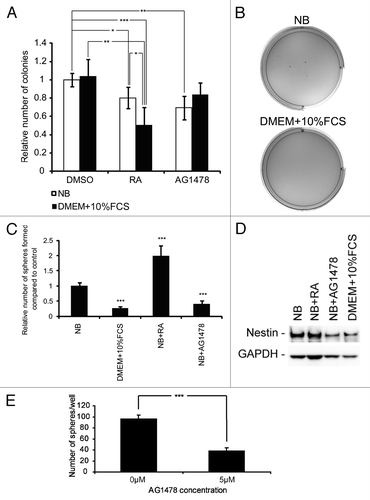
Figure 4. GBM neurosphere tumorigenicity and stem cell-like potential is reduced upon induced differentiation and after EGFR inhibition. (A) Soft agar assay showing reduced colony formation after induced differentiation or AG1478 treatment. Data are presented as mean ± SD of two independent experiments performed in duplicates. (B) Representative pictures of soft agar assay using either NB media or DMEM + 10% FCS. (C) Sub-sphere assay showing reduced sphere forming potential after pre-treatment with serum (DMEM + 10% FCS), RA, or AG1478 as compared with spheres formed in NB media only. Data presented are from one out of two independent experiments performed in sextuplicates and are presented as mean number of spheres ± SD. (D) WB showing downregulation of Nestin expression after exposure to serum (DMEM+10%FCS) or inhibition of EGFR signaling with AG1478. (E) Primary sphere formation is reduced upon abrogation of EGFR signaling with AG1478. Data are presented as mean number of spheres ± SD. Statistical significance was calculated between treated and corresponding control, if not indicated otherwise, using the Student two-sided t test. ***P < 0.005, **P < 0.01, and *P < 0.05.

Figure 5. Schematic view of proposed serum- and RA-induced differentiation of bCSC. Serum induces a close-to terminal differentiation of immature cancer cells such as bCSC and progenitor cells. The resulting cells lose EGFR and EGFRvIII expression, and downregulates Nestin while upregulating GFAP expression. However, the cells still retain some tumorigenic potential and proliferate, although they are not able to self-renew. RA induces less differentiation than serum as visible by less upregulation of GFAP and almost unchanged Nestin expression. In addition, the cells retain some capacity of self-renewal and proliferation and as such they could represent some stage of progenitor cell differentiation. However, both EGFR and EGFRvIII expression are lost upon differentiation, indicating that these receptors are expressed in an immature and undifferentiated cell type such as the bCSC.
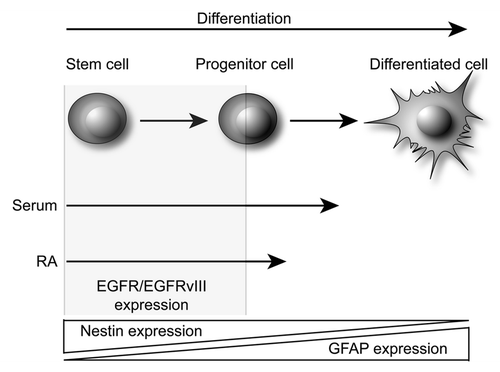
Figure 5. Schematic view of proposed serum- and RA-induced differentiation of bCSC. Serum induces a close-to terminal differentiation of immature cancer cells such as bCSC and progenitor cells. The resulting cells lose EGFR and EGFRvIII expression, and downregulates Nestin while upregulating GFAP expression. However, the cells still retain some tumorigenic potential and proliferate, although they are not able to self-renew. RA induces less differentiation than serum as visible by less upregulation of GFAP and almost unchanged Nestin expression. In addition, the cells retain some capacity of self-renewal and proliferation and as such they could represent some stage of progenitor cell differentiation. However, both EGFR and EGFRvIII expression are lost upon differentiation, indicating that these receptors are expressed in an immature and undifferentiated cell type such as the bCSC.

Reprints and Corporate Permissions

Please note: Selecting permissions does not provide access to the full text of the article, please see our help page How do I view content?

To request a reprint or corporate permissions for this article, please click on the relevant link below:

Academic Permissions

Please note: Selecting permissions does not provide access to the full text of the article, please see our help page How do I view content?

Obtain permissions instantly via Rightslink by clicking on the button below:

If you are unable to obtain permissions via Rightslink, please complete and submit this Permissions form. For more information, please visit our Permissions help page.