1,423
Views
64
CrossRef citations to date
0
Altmetric
Research Paper

MicroRNA expression signatures of stage, grade, and progression in clear cell RCC

, , , , , , & show all
Pages 329-341 | Received 16 Oct 2013, Accepted 21 Nov 2013, Published online: 18 Dec 2013

Figures & data

Table 1. Clinicopathological data for the 94 ccRCC

Table 2. miRNAs with significant differential expression across analyses of stage, grade, and disease progression

Figure 1. miRNA expression can distinguish early and advanced ccRCC. (A) Unsupervised two-dimensional hierarchical clustering of 58 ccRCC samples using a data matrix of the 19 probes with an FDR < 0.2 and P < 0.05 and >1.5-fold change of the level of expression between 29 LGLS and 29 HGHS ccRCC. Tumor samples are displayed on the horizontal axis and individual miRNAs on the vertical axis. Tumor samples are designated L for LGLS and H for HGHS. The dendrogram on the horizontal axis indicates the two highest level clusters of tumors. (B) Real-time RT-PCR was performed on all the 58 ccRCC samples run on the array to amplify the six most differentially expressed miRNAs indicated by microarray analysis. Relative quantification was achieved by plotting 2(−∆CT) values of all the early and advanced groups of samples.
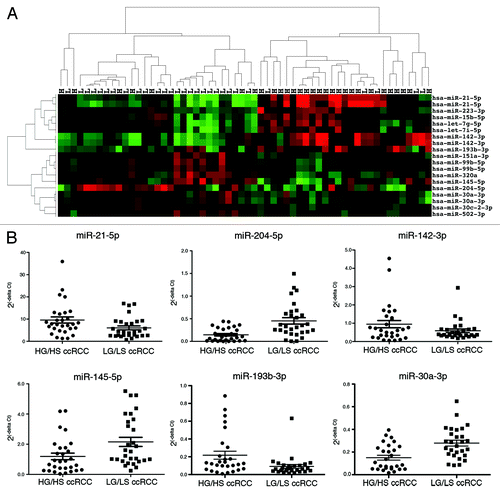
Figure 1. miRNA expression can distinguish early and advanced ccRCC. (A) Unsupervised two-dimensional hierarchical clustering of 58 ccRCC samples using a data matrix of the 19 probes with an FDR < 0.2 and P < 0.05 and >1.5-fold change of the level of expression between 29 LGLS and 29 HGHS ccRCC. Tumor samples are displayed on the horizontal axis and individual miRNAs on the vertical axis. Tumor samples are designated L for LGLS and H for HGHS. The dendrogram on the horizontal axis indicates the two highest level clusters of tumors. (B) Real-time RT-PCR was performed on all the 58 ccRCC samples run on the array to amplify the six most differentially expressed miRNAs indicated by microarray analysis. Relative quantification was achieved by plotting 2(−∆CT) values of all the early and advanced groups of samples.

Figure 2. miRNA expression separates a majority of high stage from low stage ccRCC. Unsupervised two-dimensional hierarchical clustering with a data matrix of 13 probes in 81 annotated ccRCC (46 LS and 35 HS).

Figure 2. miRNA expression separates a majority of high stage from low stage ccRCC. Unsupervised two-dimensional hierarchical clustering with a data matrix of 13 probes in 81 annotated ccRCC (46 LS and 35 HS).

Figure 3. miRNA expression can differentiate high grade from low grade ccRCC. (A) Unsupervised two-dimensional hierarchical clustering with a data matrix of 17 probes in 94 ccRCC (44 LG and 50 HG). (B) Unsupervised two-dimensional hierarchical clustering with a data matrix of 37 probes in 23 ccRCC (7 grade I and 16 grade IV). (C) Unsupervised two-dimensional hierarchical clustering with a data matrix of 7 probes in 59 ccRCC (38 LGLS and 21 HGLS). LL, low stage, low grade; LH, low stage, high grade.
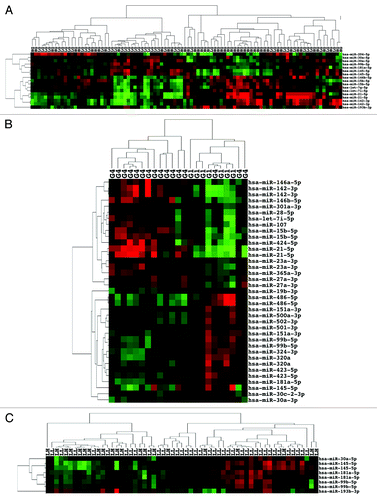
Figure 3. miRNA expression can differentiate high grade from low grade ccRCC. (A) Unsupervised two-dimensional hierarchical clustering with a data matrix of 17 probes in 94 ccRCC (44 LG and 50 HG). (B) Unsupervised two-dimensional hierarchical clustering with a data matrix of 37 probes in 23 ccRCC (7 grade I and 16 grade IV). (C) Unsupervised two-dimensional hierarchical clustering with a data matrix of 7 probes in 59 ccRCC (38 LGLS and 21 HGLS). LL, low stage, low grade; LH, low stage, high grade.

Figure 4. miRNA expression can distinguish de novo metastatic ccRCC as well as de novo non-metastatic ccRCC that subsequently progressed. (A) Unsupervised two-dimensional hierarchical clustering with a data matrix of 46 probes in 70 ccRCC (51 NP and 19 P). (B) Unsupervised two-dimensional hierarchical clustering with a data matrix of 24 probes in 94 ccRCC (51 NM and 43 M).
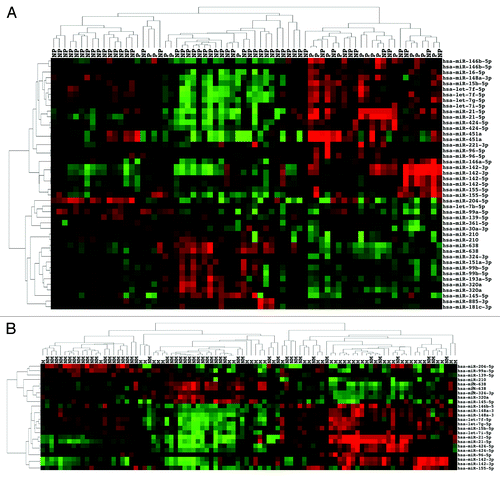
Figure 4. miRNA expression can distinguish de novo metastatic ccRCC as well as de novo non-metastatic ccRCC that subsequently progressed. (A) Unsupervised two-dimensional hierarchical clustering with a data matrix of 46 probes in 70 ccRCC (51 NP and 19 P). (B) Unsupervised two-dimensional hierarchical clustering with a data matrix of 24 probes in 94 ccRCC (51 NM and 43 M).
Supplemental material

Additional material

Download Zip (1.8 MB)