Figures & data
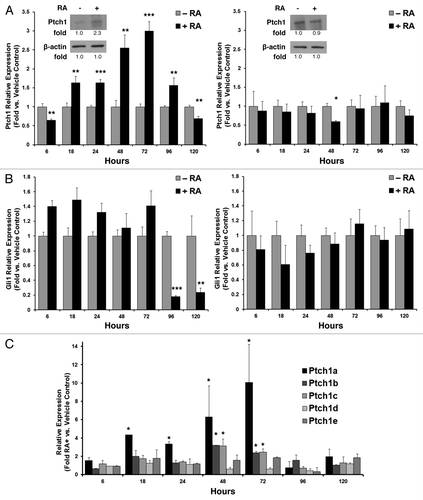
Figure 1. Ptch1 expression after RA-treatment of human NT2/D1 EC cells. (A) Ptch1 mRNA expression as measured by qPCR assays was displayed independently for NT2/D1 EC cells (left panel; Ptch1 immunoblot with indicated quantification) and RA-resistant NT2/D1-R1 cells (right panel; Ptch1 immunoblot with indicated quantification) treated for 5 d with RA (10 µM) vs. vehicle control. (B) Gli1 mRNA expression is independently displayed for NT2/D1 (left panel) and NT2/D1-R1 cells (right panel). (C) The relative mRNA expression of the indicated Ptch1 isoforms was presented over a 5-d time course of RA (10 µM) treatment vs. vehicle control. Statistical significance is indicated by *P ≤ 0.05, **P ≤ 0.01, ***P ≤ 0.001, respectively.

Figure 2. Ptch1 upregulation after RA-treatment was independent of Smo activity. (A) Ptch1 mRNA expression as measured by qPCR assays was displayed for NT2/D1 cells following single or combined treatment with RA (10 µM) or a Smo inhibitor (cyclopamine [10 µM] or GDC-0449 [10 µM]), vs. vehicle-treated control. (B) The activity of a Gli-BSLuc Gli-responsive luciferase reporter plasmid relative to a constitutive TK-luciferase reporter plasmid was examined following RA (10 µM) treatment or vehicle treatment over the indicated time period. Each transfection was normalized to renilla luciferase activity. (C) The relative mRNA expression profiles of Ptch1 and Gli1 were compared between AB2.2 murine ES cell embryoid bodies formed in the presence of RA (0.5 µM) vs. vehicle control at the indicated time points, with the symbol * indicating P ≤ 0.05 relative to day 0 baseline expression, set to a value of 1. (D) The relative mRNA expression of Ptch1 following RA-treatment vs. vehicle control was assessed in these differentiation-sensitive cancer cell lines: NB4, Tera-1, and P19. The symbol * indicated P ≤ 0.05 in all panels.
![Figure 2. Ptch1 upregulation after RA-treatment was independent of Smo activity. (A) Ptch1 mRNA expression as measured by qPCR assays was displayed for NT2/D1 cells following single or combined treatment with RA (10 µM) or a Smo inhibitor (cyclopamine [10 µM] or GDC-0449 [10 µM]), vs. vehicle-treated control. (B) The activity of a Gli-BSLuc Gli-responsive luciferase reporter plasmid relative to a constitutive TK-luciferase reporter plasmid was examined following RA (10 µM) treatment or vehicle treatment over the indicated time period. Each transfection was normalized to renilla luciferase activity. (C) The relative mRNA expression profiles of Ptch1 and Gli1 were compared between AB2.2 murine ES cell embryoid bodies formed in the presence of RA (0.5 µM) vs. vehicle control at the indicated time points, with the symbol * indicating P ≤ 0.05 relative to day 0 baseline expression, set to a value of 1. (D) The relative mRNA expression of Ptch1 following RA-treatment vs. vehicle control was assessed in these differentiation-sensitive cancer cell lines: NB4, Tera-1, and P19. The symbol * indicated P ≤ 0.05 in all panels.](/cms/asset/2460f77b-9885-4475-a034-8f71046406e8/kcbt_a_10927821_f0002.gif)
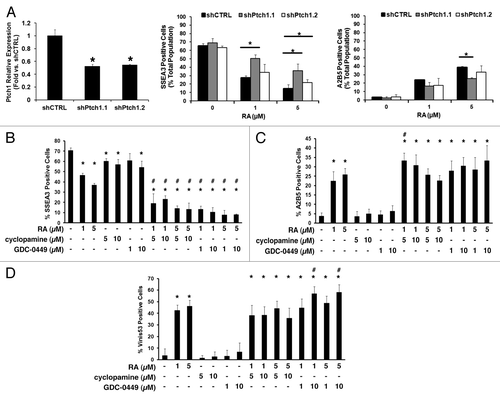
Figure 3. The Hh pathway contributes to induced NT2/D1 cell differentiation. (A) NT2/D1 cells were individually stably transduced with two independent shRNAs targeting Ptch1 or an insertless control vector, and Ptch1 mRNA knockdown was confirmed (left panel). The consequences of stable Ptch1 knockdown on differentiation marker expression following 5 d of RA treatment vs. controls are shown (SSEA3, middle panel; A2B5, right panel). Analysis of expression of the (B) SSEA3 undifferentiated marker, (C) A2B5 neuronal marker, and (D) Vinis53 non-neuronal marker in NT2/D1 cells by flow cytometry after 5 d treatment with RA, cyclopamine, or GDC-0449, alone or in the indicated combinations are displayed. The symbol * depicts P ≤ 0.05 vs. control in panel (A). In (B–D), the symbol * depicts P ≤ 0.05 vs. vehicle-treated control; the symbol # depicts P ≤ 0.05 for the indicated combination treatments vs. each of the respective single treatments.

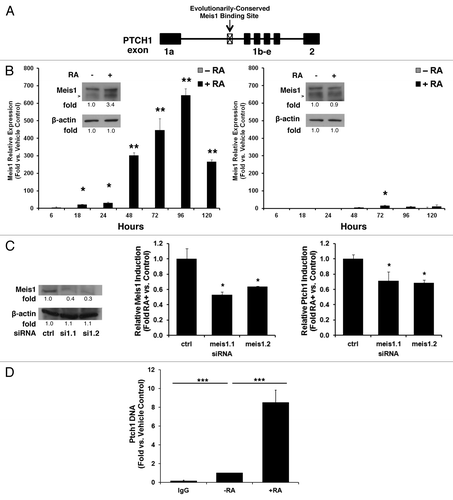
Figure 4. Meis1 binds to the PTCH1 genomic site and contributes to retinoid induction of Ptch1 mRNA. (A) Bioinformatic analysis of the PTCH1 gene revealed an evolutionarily conserved intronic Meis1 binding site, as shown in this schema. (B) Meis1 mRNA expression profile as measured by qPCR assays was displayed for NT2/D1 cells (left panel, immunoblot analysis with quantification and arrow depicting Meis1) or NT2/D1-R1 RA-resistant EC cells (right panel, immunoblot analysis with quantification and arrow depicting Meis1) treated for 5 d with RA (10 µM, +RA) vs. vehicle as a control (−RA). (C) NT2/D1 cells were transiently transfected with two independent siRNAs targeting Meis1 or a scrambled control siRNA. Knockdown was confirmed (left panel Meis1 immunoblot analysis with quantification). Relative levels of Meis1 induction after 3 d of treatment with RA (10 µM) or vehicle as a control for the Meis1 knockdown is displayed (center panel). Relative levels of Ptch1 induction after 3 d of treatment with RA (10 µM) or vehicle as a control in NT2/D1 cells are shown after Meis1 knockdown (right panel). (D) ChIP assays identified a PTCH1 DNA complex by use of a Meis1-specific antibody following 3 d of treatment with RA (10 µM) vs. vehicle as a control (−RA). The symbols indicated *P ≤ 0.05, **P ≤ 0.01, and ***P ≤ 0.001.

Table 1. The Meis1 binding site in the PTCH1 gene is evolutionarily conserved.
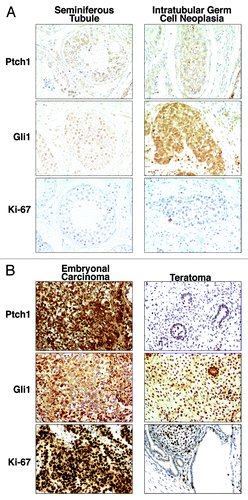
Figure 5. Hedgehog pathway member immunohistochemical expression profiles in embryonal carcinoma, teratoma, and testis. Gli1, Ptch1, and Ki-67 (a proliferation marker) immunohistochemical expression patterns are displayed in (A) a representative histopathologically normal seminiferous tubule vs. intratubular germ cell neoplasia and (B) a representative embryonal carcinoma vs. adjacent teratoma. All panels are shown as 100× magnification.

