Figures & data
Figure 1. Expression levels of DDR2 transcripts and proteins in HNSCC clinical specimens. (A) Expression levels of DDR2 in 29 pairs of fresh primary HNSCC and corresponding normal clinical specimens were measured by qPCR. One of the low grade tumors’ transcripts (number 5) was used for normalization. (B) Immunohistochemical staining for DDR2 expression in 79 human HNSCC specimens (54 specimens of low grade tumors and 25 specimens of high grade tumors) and 39 cancer-associated normal (cancer-assoc. nl) specimens. Shown is a representative example of high grade HNSCC sample (right), low grade HNSCC sample (middle) and cancer-associated normal tissue sample (left). (C) Staining evaluation for the immunohistochemical staining of DDR2 expression. The staining grade is stratified as absent (−), weak (+), moderate (++), or strong (+++). Shown is a representative example of each grade. (D) Statistical analysis for immunohistochemical staining of DDR2 expression between human HNSCC specimens and cancer-associated normal specimens. (E) Statistical analysis for the relationship between the immunohistochemical staining of DDR2 expression and HNSCC characteristics. Data are presented as the mean ± SD or n (number of samples). Statistical significance was evaluated with the Student t test or χ2 test.
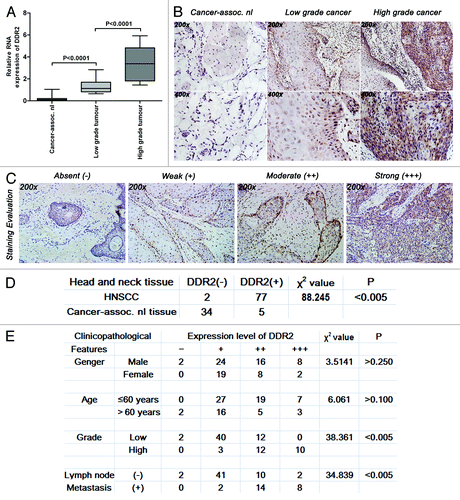
Figure 2. Expression of DDR2, E-cadherin, and vimentin in HNSCC cell lines. (A and B) Tca8113, TB, SCC25, and FaDu cells were subjected to analysis of mRNA and protein expression of E-cadherin and vimentin by qPCR and western blot, respectively. Statistical significance was evaluated with the Student t test. Results display the mean ± SD. ***P < 0.001. (C) mRNA and protein expression of DDR2 in HNSCC cell lines was analyzed by reverse transcription PCR and western blot, respectively. β-actin was used as a loading control.
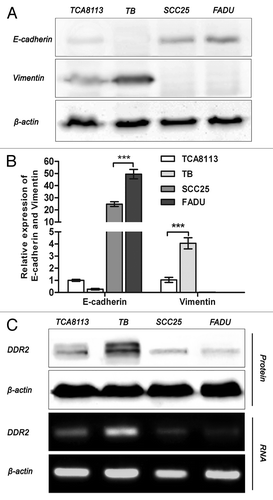
Figure 3. DDR2 overexpression has no effect on cell proliferation in HNSCC cells. (A) Tca8113 and FaDu cells (parental, EGFP-, and DDR2-transduced) were cultured in serum-free medium for 24 h. Thereafter, protein and RNA from these cells were extracted and analyzed for DDR2 expression using western blot and qPCR. (B) The cell growth curves of Tca8113 cells (parental, EGFP-, and DDR2-transduced) by MTT method. (C) Tca8113 cells (parental, EGFP-, and DDR2-transduced) treated by EdU were viewed and photographed using a fluorescence microscope. The staining positive rate was counted as positive cells/overall cells × 100%. For each group, ten random high-power fields (400×) were chosen and the cell number was counted at least three times. The histogram represents the staining positive rate of each group. (D) Tca8113 cells infected with Ad-DDR2 were similar to the controls by FAC assays. Statistical significance was evaluated with the Student t test. Results display the mean ± SD. ***P < 0.001.
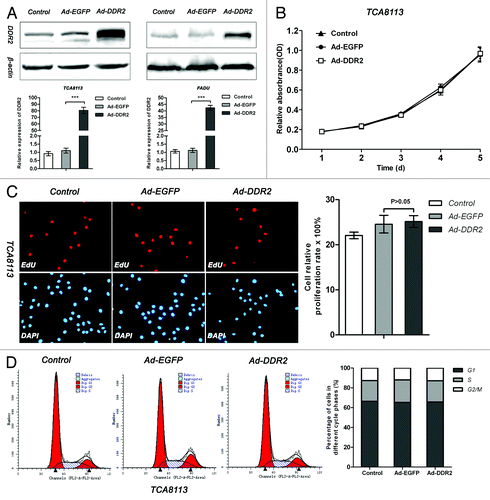
Figure 4. Overexpression of DDR2 enhances the invasion and migration in HNSCC cells. (A and B) Tca8113 and FaDu cells (parental, EGFP-, and DDR2-transduced) were incubated in serum-free medium with or without 2 µg/mL type I collagen (Col I) for 24 h. The histogram represents the average number of invaded and migrated cells in five random low-power fields (200×). The numbers from the control groups were used as control. Statistical significance was evaluated with the Student t test. Results display the mean ± SD. ***P < 0.001. (C) The cells in (A) were subjected to analysis of protein expression of MMP-2 and MMP-9 using western blot.
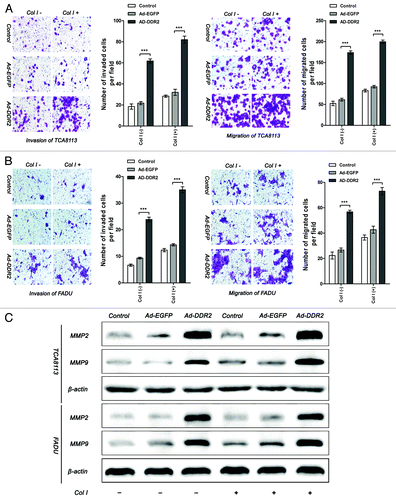
Figure 5. Overexpression of DDR2 accelerates the process of hypoxia-induced EMT in HNSCC cells. (A) Tca8113 and FaDu cells (parental and DDR2-transduced) were cultured under normoxic or hypoxic condition for 48 h, and the morphology change of cells were photographed in low-power field (200×). (B) The cells in (A) were stained for the expression of E-cadherin (red) and vimentin (green) by immunocytofluorescence. Nuclei are labeled by DAPI (blue). Scale bar 10 µm. (C) The cells in (A) were used for immunoblot analysis of E-cadherin and vimentin expression.
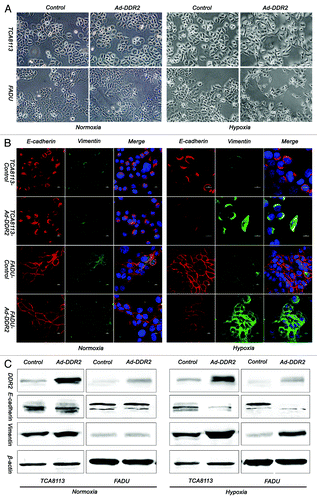
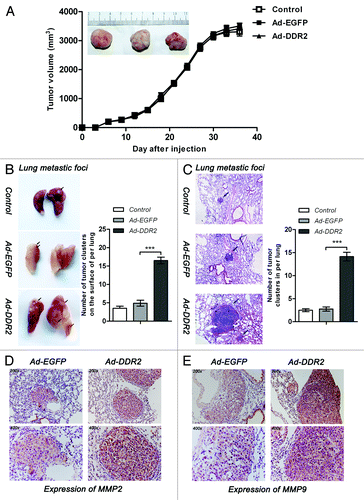
Figure 6. DDR2 enhances the metastasis potential of HNSCC cells in vivo. Tca8113 cells (parental, EGFP-, and DDR2-transduced) (2 × 10⁶/200 μL PBS) were simultaneously injected via the tail veins and subcutaneously into the hind legs of the 6-wk-old female nude mice. At day 42, mice were killed and the lungs were fixed in 4% formaldehyde for 24 h. (A) Tumor growth curve. The tumor growth was assessed every 3 d until day 42 by measuring two perpendicular diameters and calculating the volume in mm3. The typical photographs of tumors are shown. (B) The white colonies on the lung surface were enumerated macroscopically. Black arrows indicate lung metastatic tumors. Colonies were enumerated and the relative increases compared with the control groups were calculated. (C) Representative lung tissue sections from each group are shown (H&E; original magnification 100×). Black arrows indicate lung metastatic tumors. The number of lung metastatic foci in each group (n = 4) was calculated. (D and E) Immunostaining of MMP-2 and MMP-9 were performed on lung metastatic tumors (original magnification 200× and 400×). Shown are representative examples from EGFP- and DDR2-transduced groups. Statistical significance was evaluated with the Student t test. Results display the mean ± SD .***P < 0.001.