1,598
Views
30
CrossRef citations to date
0
Altmetric
Research Paper

Mice lacking G0S2 are lean and cold-tolerant

, , , , , , & show all
Pages 643-650 | Received 13 Feb 2014, Accepted 15 Feb 2014, Published online: 20 Feb 2014

Figures & data

Figure 1. Generation of G0S2−/− mice. (A) Targeting strategy of G0S2−/− mice. Homologous recombination of the targeting vector with the wild type (WT) allele resulted in the replacement of the G0S2 coding region with a lacZ and loxP-flanked neomycin resistance gene cassette. (B) Genotyping of WT (G0S2+/+), heterozygote (G0S2+/−), and homozygote (G0S2−/−) mice with primers for G0S2 and lacZ. (C) Immunoblot analysis of G0S2 protein expression with proteins from gonadal fat of G0S2+/+ and G0S2−/− mice. Actin served as loading control. (D) Evidence for lactation defects in G0S2−/− mice. A representative G0S2−/− pup fed with a G0S2−/− mother did not have a visible milk spot as seen in a pup nursed by a G0S2+/+ mother.
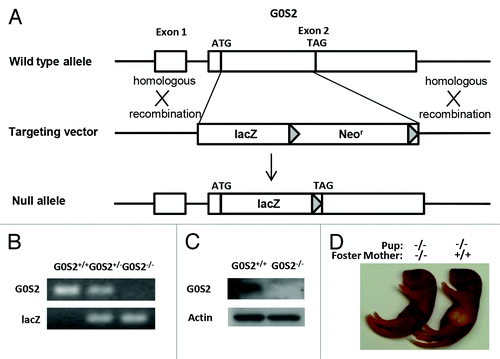
Figure 1. Generation of G0S2−/− mice. (A) Targeting strategy of G0S2−/− mice. Homologous recombination of the targeting vector with the wild type (WT) allele resulted in the replacement of the G0S2 coding region with a lacZ and loxP-flanked neomycin resistance gene cassette. (B) Genotyping of WT (G0S2+/+), heterozygote (G0S2+/−), and homozygote (G0S2−/−) mice with primers for G0S2 and lacZ. (C) Immunoblot analysis of G0S2 protein expression with proteins from gonadal fat of G0S2+/+ and G0S2−/− mice. Actin served as loading control. (D) Evidence for lactation defects in G0S2−/− mice. A representative G0S2−/− pup fed with a G0S2−/− mother did not have a visible milk spot as seen in a pup nursed by a G0S2+/+ mother.

Figure 2. G0S2 tissue distribution in various organs. Organs from 3 mo old male G0S2−/− and G0S2+/+ mice were independently harvested and lacZ stainings were performed in white adipose tissue (WAT), liver, skeletal muscle, heart, kidney, and lung tissues.
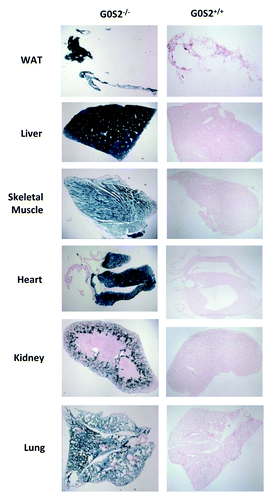
Figure 2. G0S2 tissue distribution in various organs. Organs from 3 mo old male G0S2−/− and G0S2+/+ mice were independently harvested and lacZ stainings were performed in white adipose tissue (WAT), liver, skeletal muscle, heart, kidney, and lung tissues.

Figure 3. G0S2−/− mice showed decreased relative body weight and decreased fat pad weight. (A and B) Relative body weight as compared with initial body weight (8 wk of age) of male G0S2+/+ and G0S2−/− mice during 14 wk fed on a 10% fat diet (A, upper panel) or a 45% fat diet (B, upper panel). Food intake of G0S2+/+ and G0S2−/− mice during 14 wk on a 10% fat diet (A, lower panel) and 45% fat diet (B, lower panel) (n = 12). (C and D) Organ weight (left panel) and fat pad weight (right panel) of male mice fed a 10% fat diet (C) and 45% fat diet (D) (n = 8–9). Gon Fat, gonadal fat pad; Ing Fat, inguinal fat pad; Ren fat, renal fat pad; BAT, interscapular brown adipose tissue. The symbols * and ** depict statistical significance as P < 0.05 and P < 0.01, respectively.
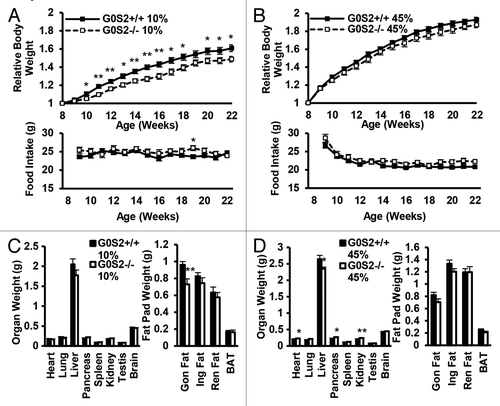
Figure 3. G0S2−/− mice showed decreased relative body weight and decreased fat pad weight. (A and B) Relative body weight as compared with initial body weight (8 wk of age) of male G0S2+/+ and G0S2−/− mice during 14 wk fed on a 10% fat diet (A, upper panel) or a 45% fat diet (B, upper panel). Food intake of G0S2+/+ and G0S2−/− mice during 14 wk on a 10% fat diet (A, lower panel) and 45% fat diet (B, lower panel) (n = 12). (C and D) Organ weight (left panel) and fat pad weight (right panel) of male mice fed a 10% fat diet (C) and 45% fat diet (D) (n = 8–9). Gon Fat, gonadal fat pad; Ing Fat, inguinal fat pad; Ren fat, renal fat pad; BAT, interscapular brown adipose tissue. The symbols * and ** depict statistical significance as P < 0.05 and P < 0.01, respectively.

Figure 4. Serum glycerol and free fatty acid levels in G0S2+/+ and G0S2−/− mice. Serum from 5 mo old male G0S2+/+ and G0S2−/− mice fed with 10% fat diet were analyzed for (A) glycerol and (B) free fatty acid (n = 11–12). Data are presented as mean ± SE. The symbol * depicts statistical significance as P < 0.05.
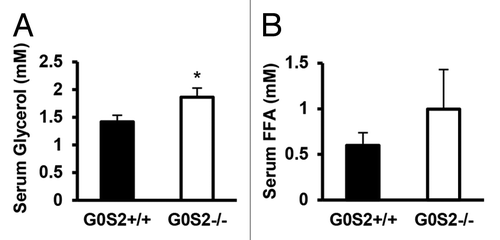
Figure 4. Serum glycerol and free fatty acid levels in G0S2+/+ and G0S2−/− mice. Serum from 5 mo old male G0S2+/+ and G0S2−/− mice fed with 10% fat diet were analyzed for (A) glycerol and (B) free fatty acid (n = 11–12). Data are presented as mean ± SE. The symbol * depicts statistical significance as P < 0.05.

Figure 5. O2 consumption, respiratory quotient and percentage active time of G0S2−/− mice vs. G0S2+/+ mice. (A–C) Time course of (A) O2 consumption, (B) respiratory quotient, and (C) percentage active time of G0S2+/+ vs. G0S2−/− male mice fed a 10% fat diet (left panel) or a 45% fat diet (right panel) during 24 h with access to food and water ad libitum (n = 12). Data are presented as mean ± SE. The symbol * depicts statistical significance as P < 0.05.
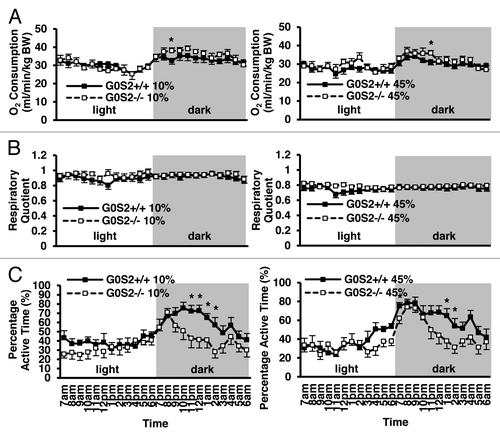
Figure 5. O2 consumption, respiratory quotient and percentage active time of G0S2−/− mice vs. G0S2+/+ mice. (A–C) Time course of (A) O2 consumption, (B) respiratory quotient, and (C) percentage active time of G0S2+/+ vs. G0S2−/− male mice fed a 10% fat diet (left panel) or a 45% fat diet (right panel) during 24 h with access to food and water ad libitum (n = 12). Data are presented as mean ± SE. The symbol * depicts statistical significance as P < 0.05.

Figure 6. G0S2−/− mice had improved cold tolerance. (A and B) Body temperatures of 7-mo-old male mice fed with a 10% fat diet (A) and a 45% fat diet (B) were determined during exposure to 4 °C for 3 h (n = 7). (C) Real-time PCR analysis of gene products involved in thermogenesis and fatty acid oxidation in brown adipose tissue (BAT) of G0S2+/+ and G0S2−/− mice fed with a 10% fat diet following 3 h of cold exposure (4 °C) (n = 4). Data are presented as mean ± SE. The symbols * and ** depict statistical significance as P < 0.05 and P < 0.01, respectively.
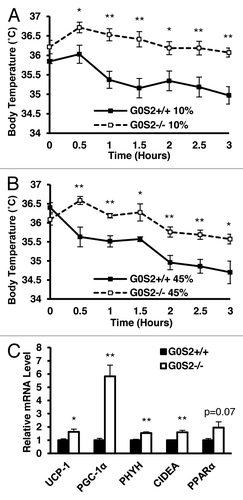
Figure 6. G0S2−/− mice had improved cold tolerance. (A and B) Body temperatures of 7-mo-old male mice fed with a 10% fat diet (A) and a 45% fat diet (B) were determined during exposure to 4 °C for 3 h (n = 7). (C) Real-time PCR analysis of gene products involved in thermogenesis and fatty acid oxidation in brown adipose tissue (BAT) of G0S2+/+ and G0S2−/− mice fed with a 10% fat diet following 3 h of cold exposure (4 °C) (n = 4). Data are presented as mean ± SE. The symbols * and ** depict statistical significance as P < 0.05 and P < 0.01, respectively.

Reprints and Corporate Permissions

Please note: Selecting permissions does not provide access to the full text of the article, please see our help page How do I view content?

To request a reprint or corporate permissions for this article, please click on the relevant link below:

Academic Permissions

Please note: Selecting permissions does not provide access to the full text of the article, please see our help page How do I view content?

Obtain permissions instantly via Rightslink by clicking on the button below:

If you are unable to obtain permissions via Rightslink, please complete and submit this Permissions form. For more information, please visit our Permissions help page.