1,079
Views
34
CrossRef citations to date
0
Altmetric
Research Paper

Etoposide-loaded immunoliposomes as active targeting agents for GD2-positive malignancies

, , , , , & show all
Pages 851-861 | Received 02 Feb 2014, Accepted 13 Apr 2014, Published online: 22 Apr 2014

Figures & data

Table 1. Liposome characteristics and drug loading as determined by dynamic light scatting and HPLC

Figure 1. Physiochemical characterization of liposomes. (A) Transmission electron micrograph with negative staining of immunoliposomes examined at low magnification (scale bar: 1 μm). (B) Anti-GD2 immunoliposomes were incubated with anti-mouse IgG gold antibodies, washed, and negative-stained to assess anti-GD2 antibody distribution (scale bar: 100 nm). (C) Control liposomes without targeting antibodies were stained similarly to (B) with anti-mouse IgG gold and no gold was visible after negative staining (scale bar: 100 nm). (D) An immunoliposome schematic underlines the relative locations of associated drug, polyethylene glycol chains and anti-GD2 targeting antibodies. Multiple lamella were observed in some liposomes via transmission electron microscopy. (E) Dynamic light scattering data displays the mean liposomal hydrodynamic diameter and associated polydispersity. (F) Fourier transformed infrared spectra of ultrafiltered anti-GD2 antibody (top), maleimide polyethylene glycol polymer crosslinker (middle), and conjugation product of the two (bottom) depicts specific spectral peaks of each of the immunoliposome components. Boxes represent peaks of characteristic bonds in each component or the conjugation product.
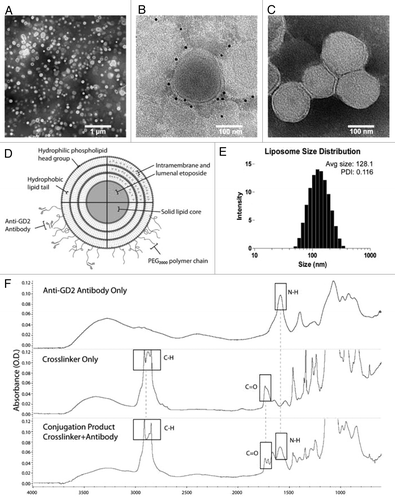
Figure 1. Physiochemical characterization of liposomes. (A) Transmission electron micrograph with negative staining of immunoliposomes examined at low magnification (scale bar: 1 μm). (B) Anti-GD2 immunoliposomes were incubated with anti-mouse IgG gold antibodies, washed, and negative-stained to assess anti-GD2 antibody distribution (scale bar: 100 nm). (C) Control liposomes without targeting antibodies were stained similarly to (B) with anti-mouse IgG gold and no gold was visible after negative staining (scale bar: 100 nm). (D) An immunoliposome schematic underlines the relative locations of associated drug, polyethylene glycol chains and anti-GD2 targeting antibodies. Multiple lamella were observed in some liposomes via transmission electron microscopy. (E) Dynamic light scattering data displays the mean liposomal hydrodynamic diameter and associated polydispersity. (F) Fourier transformed infrared spectra of ultrafiltered anti-GD2 antibody (top), maleimide polyethylene glycol polymer crosslinker (middle), and conjugation product of the two (bottom) depicts specific spectral peaks of each of the immunoliposome components. Boxes represent peaks of characteristic bonds in each component or the conjugation product.

Figure 2. Surface GD2 expression. Eight cell lines from various cancer types were treated with anti-GD2 antibodies followed by fluorescent anti-mouse secondary antibodies or fluorescent secondary antibodies alone as a control and analyzed by flow cytometry. GD2 expression is represented by fold increases in geometric means of fluorescence intensity in anti-GD2 antibody + secondary antibody treated cells compared with cells incubated with secondary antibodies alone. Values represent averages of at least three independent experiments with at least 10 000 counts per experiment.
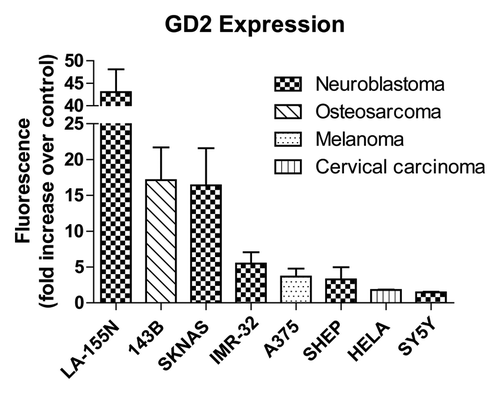
Figure 2. Surface GD2 expression. Eight cell lines from various cancer types were treated with anti-GD2 antibodies followed by fluorescent anti-mouse secondary antibodies or fluorescent secondary antibodies alone as a control and analyzed by flow cytometry. GD2 expression is represented by fold increases in geometric means of fluorescence intensity in anti-GD2 antibody + secondary antibody treated cells compared with cells incubated with secondary antibodies alone. Values represent averages of at least three independent experiments with at least 10 000 counts per experiment.

Figure 3. Liposome targeting in cells with high GD2 expression. Liposome and immunoliposome formulations produced with equivalent amounts of fluorescent lipids were incubated with LA-155N, 143b, SKNAS and IMR-32 cell lines for 30 min on ice. We evaluated the surface attachment of fluorescently labeled targeted vs untargeted or mistargeted liposomes to the surface of cells by flow cytometry. Fluorescence thresholds were set at the 95% fluorescence percentile for each cell line treated with fluorescent untargeted control liposomes. (A) Density plots are arranged by side scatter vs fluorescent intensity of cell lines (left) treated with one of the four liposome formulations (untargeted, nonspecific-IgG, anti-STAM, or anti-GD2) and analyzed by flow cytometry. (B) Cell populations with positive binding by liposomes are represented graphically as a percent of total cell populations recorded above the threshold. (C) Histograms represent fluorescent intensity of recorded cells treated with fluorescent untargeted liposomes (black) compared with fluorescent anti-GD2 immunoliposomes (red).
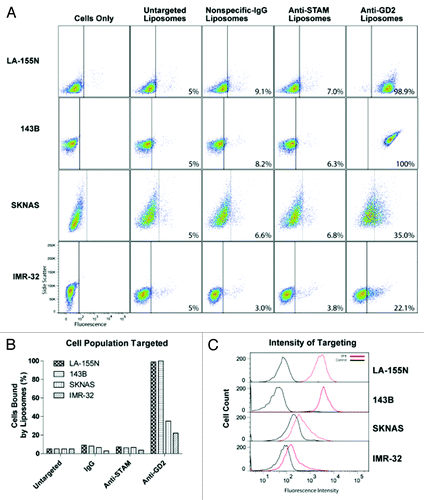
Figure 3. Liposome targeting in cells with high GD2 expression. Liposome and immunoliposome formulations produced with equivalent amounts of fluorescent lipids were incubated with LA-155N, 143b, SKNAS and IMR-32 cell lines for 30 min on ice. We evaluated the surface attachment of fluorescently labeled targeted vs untargeted or mistargeted liposomes to the surface of cells by flow cytometry. Fluorescence thresholds were set at the 95% fluorescence percentile for each cell line treated with fluorescent untargeted control liposomes. (A) Density plots are arranged by side scatter vs fluorescent intensity of cell lines (left) treated with one of the four liposome formulations (untargeted, nonspecific-IgG, anti-STAM, or anti-GD2) and analyzed by flow cytometry. (B) Cell populations with positive binding by liposomes are represented graphically as a percent of total cell populations recorded above the threshold. (C) Histograms represent fluorescent intensity of recorded cells treated with fluorescent untargeted liposomes (black) compared with fluorescent anti-GD2 immunoliposomes (red).
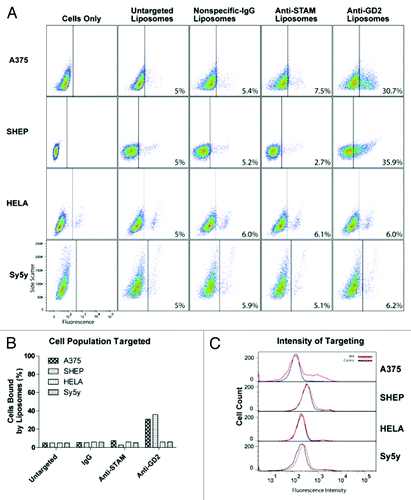
Figure 4. Liposome targeting in the four cell lines tested with the lowest GD2 expression. Liposome and immunoliposome formulations with equivalent amounts of fluorescent lipids were incubated with A375, SHEP, HeLa, and SY5Y cell lines for 30 min on ice. We evaluated the surface attachment of fluorescently labeled targeted vs untargeted or mistargeted liposomes to the surface of cells by flow cytometry. Fluorescence thresholds were set at the 95% fluorescence percentile for each cell line treated with fluorescent untargeted control liposomes. (A) Density plots are arranged by side scatter vs fluorescent intensity of cell lines (left) treated with one of the four liposome formulations (untargeted, nonspecific-IgG, anti-STAM, or anti-GD2) and analyzed by flow cytometry. (B) Cell populations with positive binding by liposomes are represented graphically as a percent of total cell populations recorded above the threshold. (C) Histograms represent fluorescent intensity of recorded cells treated with fluorescent untargeted liposomes (black) compared with fluorescent anti-GD2 immunoliposomes (red).

Figure 4. Liposome targeting in the four cell lines tested with the lowest GD2 expression. Liposome and immunoliposome formulations with equivalent amounts of fluorescent lipids were incubated with A375, SHEP, HeLa, and SY5Y cell lines for 30 min on ice. We evaluated the surface attachment of fluorescently labeled targeted vs untargeted or mistargeted liposomes to the surface of cells by flow cytometry. Fluorescence thresholds were set at the 95% fluorescence percentile for each cell line treated with fluorescent untargeted control liposomes. (A) Density plots are arranged by side scatter vs fluorescent intensity of cell lines (left) treated with one of the four liposome formulations (untargeted, nonspecific-IgG, anti-STAM, or anti-GD2) and analyzed by flow cytometry. (B) Cell populations with positive binding by liposomes are represented graphically as a percent of total cell populations recorded above the threshold. (C) Histograms represent fluorescent intensity of recorded cells treated with fluorescent untargeted liposomes (black) compared with fluorescent anti-GD2 immunoliposomes (red).

Figure 5. In vitro liposomal uptake. (A) LA-155N cells were incubated with liposomes at 37 °C for 30 min followed by confocal microscopy analysis. Uptake of untargeted or anti-GD2 targeted liposomes (red) was examined. Cells were also labeled with a nuclear DAPI stain (blue). (B) SKNAS cells were incubated with the endocytosis inhibitor Dynasore, Filipin, or both drugs for 30 min followed by co-incubation of inhibitors and fluorescent untargeted or anti-GD2 immunoliposomes for 1 h. Cells were washed, fixed, and imaged by fluorescence microscopy. Regions of interest were drawn around representative cell perimeters and cytosolic fluorescent intensities were recorded from at least 20 fields of view for each treatment group. Means were compared by one way ANOVA for significance. *P < 0.05. (C) Representative images from the fluorescent microscope of cells treated with Filipin, Dynasore, a combination of the two, or no drug in addition to anti-GD2 liposomes.
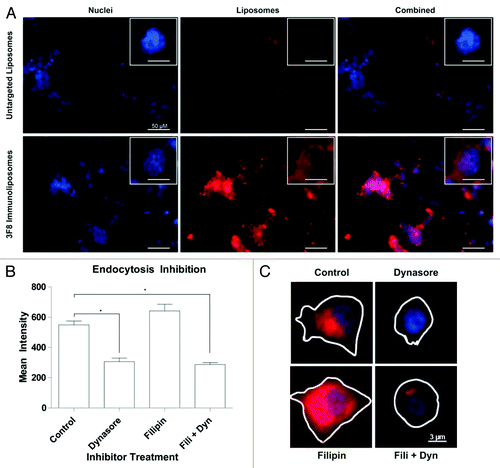
Figure 5. In vitro liposomal uptake. (A) LA-155N cells were incubated with liposomes at 37 °C for 30 min followed by confocal microscopy analysis. Uptake of untargeted or anti-GD2 targeted liposomes (red) was examined. Cells were also labeled with a nuclear DAPI stain (blue). (B) SKNAS cells were incubated with the endocytosis inhibitor Dynasore, Filipin, or both drugs for 30 min followed by co-incubation of inhibitors and fluorescent untargeted or anti-GD2 immunoliposomes for 1 h. Cells were washed, fixed, and imaged by fluorescence microscopy. Regions of interest were drawn around representative cell perimeters and cytosolic fluorescent intensities were recorded from at least 20 fields of view for each treatment group. Means were compared by one way ANOVA for significance. *P < 0.05. (C) Representative images from the fluorescent microscope of cells treated with Filipin, Dynasore, a combination of the two, or no drug in addition to anti-GD2 liposomes.

Figure 6. Inhibition of cell proliferation in vitro. Tumor cells were seeded in 96-well plates and treated with various concentrations of free etoposide, liposomal etoposide, or anti-GD2 immunoliposomal etoposide for 24 h followed by an MTT viability assay. (A and B) High GD2 expressing neuroblastoma (LA-155N) and osteosarcoma (143B) cell lines were evaluated for proliferation after etoposide treatment. (C) Low GD2 expressing neuroblastoma cells (SY5Y) were also tested for changes in proliferation at etoposide concentrations 5–200 µg/mL. Mean viabilities were compared by two-way ANOVA with Bonferroni posttests between treatment types for significance. *P < 0.05.
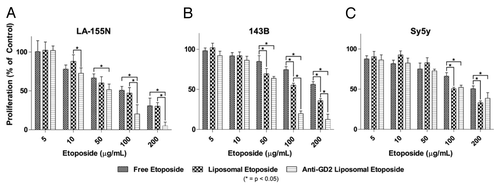
Figure 6. Inhibition of cell proliferation in vitro. Tumor cells were seeded in 96-well plates and treated with various concentrations of free etoposide, liposomal etoposide, or anti-GD2 immunoliposomal etoposide for 24 h followed by an MTT viability assay. (A and B) High GD2 expressing neuroblastoma (LA-155N) and osteosarcoma (143B) cell lines were evaluated for proliferation after etoposide treatment. (C) Low GD2 expressing neuroblastoma cells (SY5Y) were also tested for changes in proliferation at etoposide concentrations 5–200 µg/mL. Mean viabilities were compared by two-way ANOVA with Bonferroni posttests between treatment types for significance. *P < 0.05.

Reprints and Corporate Permissions

Please note: Selecting permissions does not provide access to the full text of the article, please see our help page How do I view content?

To request a reprint or corporate permissions for this article, please click on the relevant link below:

Academic Permissions

Please note: Selecting permissions does not provide access to the full text of the article, please see our help page How do I view content?

Obtain permissions instantly via Rightslink by clicking on the button below:

If you are unable to obtain permissions via Rightslink, please complete and submit this Permissions form. For more information, please visit our Permissions help page.