Figures & data
Figure 1. GRHL2 was overexpressed in CRC samples and associated with tumor progression. Immunohistochemical (IHC) staining of formalin-fixed, paraffin-embedded CRC tissues and paired non-tumor tissues was performed. Representative images illustrative of the different staining patterns are presented in (A–F). (A) Negative GRHL2 staining in no-tumor normal mucosa. (B) Nuclear staining of GRHL2 in no-tumor epithelium adjacent to CRC. (C) Negative staining of GRHL2 in CRC. (D) Weak nuclear intensity staining of GRHL2 in CRC. (E) Moderate nuclear staining of GRHL2 in CRC. (F) CRC sample showing strong nuclear staining for GRHL2. (G) Western blot analysis demonstrated GRHL2 expression was higher in six CRC specimens (T1–T6) compared with adjacent non-tumor specimens (N1–N6) relative to the loading control GAPDH. (H) Box plot depicting GRHL2 levels as assessed by qRT-PCR in the normal mucosa (NM) and our series of 75 CRC samples classified by according tumor stage (stage I+II, n = 30; stage III+ IV, n = 45). *indicates P < 0.05, *** indicates P < 0.001. (I) Semi-qRT-PCR analysis demonstrated GRHL2 expression was varied in seven different CRC cell lines.
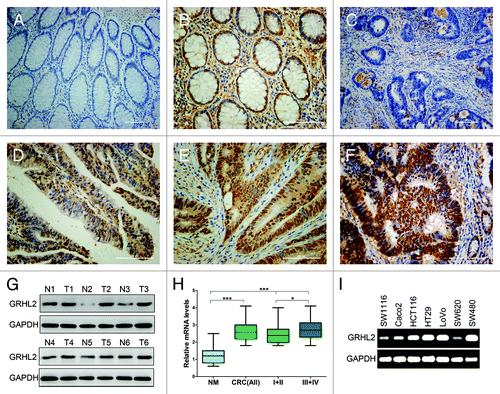
Table 1. Expression of GRHL2 in colorectal cancer tissues and matched non-tumor mucosa
Table 2. Relationship between GRHL2 expression level and clinicopathological variables in colorectal cancer patients
Figure 2. Overexpression of GRHL2 was associated with a high Ki-67 proliferative index. (A) Representative immunostaining of Ki-67. The sample with negative GRHL2 expression (left panel) showed a low proliferation index as indicated by the “Ki-67 (low)” label, whereas the sample with positive (right panel) had a high proliferation index as indicated by the “Ki-67 (high)” label. Representative photos of stained cells are shown with the original magnification of 200×. (B) Average GRHL2 mRNA expression in tumor tissues was stratified according to Ki-67 level. Cases with high Ki-67 levels also demonstrated higher GRHL2 mRNA expression (low Ki-67, n = 31; high Ki-67, n = 44). The levels of GRHL2 mRNA were examined using qRT-PCR by the 2−ΔCT method with GAPDH as the internal control. ** indicates P < 0.01.
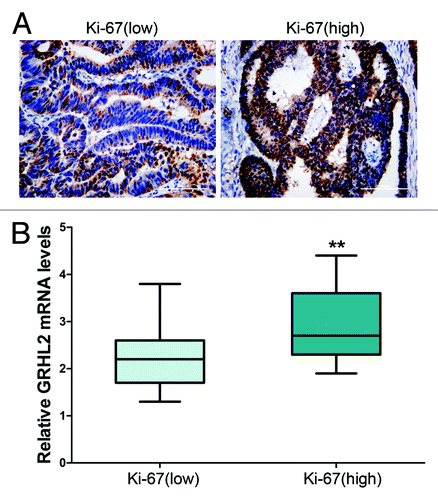
Figure 3. Downregulation of GRHL2 induced a reduction in CRC cell proliferation in vitro. (A) Knockdown of GRHL2 expression using shRNA in HT29 and HCT116 CRC cells was achieved by lentiviral shRNA transfection and confirmed by qRT-PCR. Fold change was relative to parental cells. (B) Western blot analysis of GRHL2 expression in HT29 and HCT116 cells with or without GRHL2-knockdown (left panel). Densitometric analysis is expressed relative to the loading control, GAPDH (right panel). (C) Knockdown of GRHL2 in HT29 and HCT116 cells induced a remarkable reduction in cell proliferation, as determined by CCK-8 assays. (D) The ability of CRC cells to form colonies was analyzed in a clonogenic assay. GRHL2-knockdown cells produced less and smaller plate colonies than Scr-con cells. (E) Representative charts for cell-cycle distribution in GRHL2-KD and Scr-con cells. The percentage of cells in S phase was significantly decreased in GRHL2-KD cells compared with Scr-con cells, while the population of cells in G0/G1 phases was increased. Data are expressed as means ± SD from 3 separate experiments. *Relative to Scr-con control; #relative to Parental control. *P < 0.05, **P < 0.01, ***P < 0.001, #P < 0.05, ##P < 0.01, ###P < 0.001.
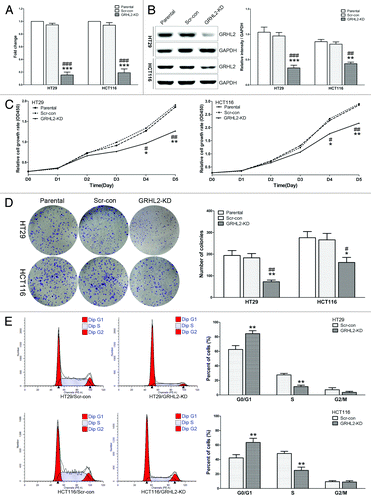
Figure 4. GRHL2-knockdown suppressed growth of CRC primary tumors in a mouse xenograft model. (A) Tumor growth was monitored in BALB/c mice implanted with Scr-con and GRHL2-KD cells. Tumor size was measured every 4 d and tumor volume was calculated as described in the Materials and Methods section. Tumors in the GRHL2-KD groups grew more slowly than those in the Scr-con groups. (B) Representative tumors from the mice of each group are shown. Tumors from the GRHL2-KD groups were smaller than those from the Scr-con groups. (C) As compared with Scr-con controls, the average tumor volumes from mice in the GRHL2-KD groups were markedly smaller. (D)The average weight of primary tumors originating from GRHL2-KD cells was lower than those from Scr-con cells. (E) Western blot was performed to confirm the downregulation of GRHL2 expression in tumors from GRHL2-KD mice. Samples were selected and paired randomly. Data were expressed as mean ± SD *indicates P < 0.05, **indicates P < 0.01.
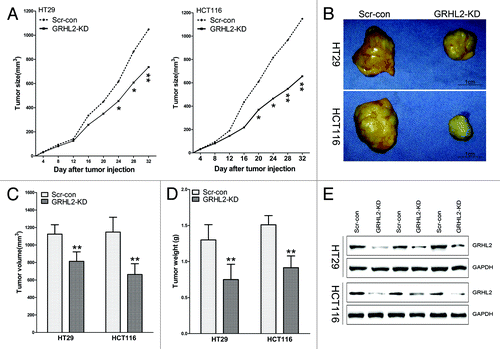
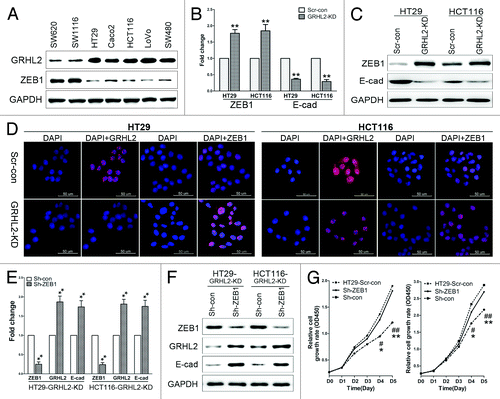
Figure 5. GRHL2-knockdown inhibited proliferation by targeting ZEB1 (A) Inverse expression pattern of GRHL2 and ZEB1 in human CRC cell lines, as demonstrated by western blot analysis. (B) Downregulation of GRHL2 resulted in increased ZEB1 mRNA expression, and decreased E-cadherin mRNA expression. Fold change was calculated relative to the mRNA expression of Scr-con cells. **P < 0.01. (C) GRHL2-knockdown increased ZEB1 and decreased E-cadherin protein expression, as determined by western blot analysis. (D) Representative images of immunofluorescence analysis using anti-GRHL2 and anti-ZEB1 antibodies are shown. Nuclei were counterstained with DAPI. Scale bar: 50 μm. (E) Transient knockdown of ZEB1 using sh-ZEB1 resulted in decreased ZEB1 mRNA expression, but increased GRHL2 and E-cadherin mRNA in GRHL2-KD HT29 and HCT116 cells. Fold change was calculated relative to the mRNA expression of Sh-con cells. **P < 0.01. (F) Sh-ZEB1 transfection decreased ZEB1 protein and increased GRHL2 and E-cadherin protein levels in GRHL2-KD cells, as determined by western blot analysis. (G) ZEB1 knockdown using Sh-ZEB1 enhanced the proliferative ability of GRHL2-KD cells to a similar level as observed in Scr-con cells. *Relative to Sh-con vs. Sh-ZEB1. *P < 0.05, **P < 0.01. #Relative to Scr-con vs. Sh-con. #P < 0.05, ##P < 0.01. Data were expressed as the means ± SD from 3 separate experiments.