1,328
Views
19
CrossRef citations to date
0
Altmetric
Research Paper

A Salmonella Typhimurium mutant strain capable of RNAi delivery

Higher tumor-targeting and lower toxicity

, , , &
Pages 1068-1076 | Received 08 Apr 2014, Accepted 09 May 2014, Published online: 19 May 2014

Figures & data

Figure 1. The toxicity effect of VNP(PhoP/Q) infection in normal mice. Tumor-free mice were infected with VNP(PhoP/Q) and VNP20009. Body weight, spleen weight and liver weight were determined at 1, 2 and 3 d post infection (n = 6). (A) Body weight, *P < 0.05, body weight in mice of VNP(PhoP/Q) or VNP20009 infection at 3 d post infection vs. 1 and 2 d post infection. (B) Spleen weight. (C) Liver weight, *P < 0.05, liver weight in mice of VNP(PhoP/Q) or VNP20009 infection at 3 d post infection vs. 1 and 2 d post infection.

Figure 1. The toxicity effect of VNP(PhoP/Q−) infection in normal mice. Tumor-free mice were infected with VNP(PhoP/Q−) and VNP20009. Body weight, spleen weight and liver weight were determined at 1, 2 and 3 d post infection (n = 6). (A) Body weight, *P < 0.05, body weight in mice of VNP(PhoP/Q−) or VNP20009 infection at 3 d post infection vs. 1 and 2 d post infection. (B) Spleen weight. (C) Liver weight, *P < 0.05, liver weight in mice of VNP(PhoP/Q−) or VNP20009 infection at 3 d post infection vs. 1 and 2 d post infection.

Figure 2. VNP(PhoP/Q) biodistribution in normal mice and tumor bearing mice. Tumor-free mice or tumor bearing mice were inoculated with VNP20009 and VNP(PhoP/Q) by intraperitoneal injection. Bacteria titer in liver and spleen of tumor-free mice were determined at 1, 2, and 3 d post infection. Bacteria titer in liver, spleen, and tumor of tumor-free mice were determined at 6 d post infection. (A and B) Bacteria titer in liver and spleen of tumor-free mice, *P < 0.05, VNP20009 vs. VNP(PhoP/Q). (C) Bacteria titer of liver, spleen, and tumor in tumor-free mice with VNP20009 and VNP(PhoP/Q) infection, *P < 0.05, VNP20009 vs. VNP(PhoP/Q). (D) Bacteria titer ratio in in tumor free mice with VNP20009 and VNP(PhoP/Q) infection, *P < 0.05, VNP20009 vs. VNP(PhoP/Q).

Figure 2. VNP(PhoP/Q−) biodistribution in normal mice and tumor bearing mice. Tumor-free mice or tumor bearing mice were inoculated with VNP20009 and VNP(PhoP/Q−) by intraperitoneal injection. Bacteria titer in liver and spleen of tumor-free mice were determined at 1, 2, and 3 d post infection. Bacteria titer in liver, spleen, and tumor of tumor-free mice were determined at 6 d post infection. (A and B) Bacteria titer in liver and spleen of tumor-free mice, *P < 0.05, VNP20009 vs. VNP(PhoP/Q−). (C) Bacteria titer of liver, spleen, and tumor in tumor-free mice with VNP20009 and VNP(PhoP/Q−) infection, *P < 0.05, VNP20009 vs. VNP(PhoP/Q−). (D) Bacteria titer ratio in in tumor free mice with VNP20009 and VNP(PhoP/Q−) infection, *P < 0.05, VNP20009 vs. VNP(PhoP/Q−).
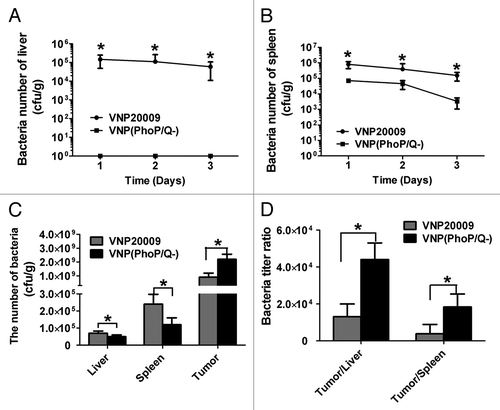
Figure 3. Subpopulation analysis of immune cells in liver and spleen of tumor-free mice. Tumor-free mice or tumor-bearing mice were inoculated with VNP20009 and VNP(PhoP/Q) by intraperitoneal injection. Immune cells in liver and spleen of tumor free mice were determined at 1, 2, and 3 d post infection. (A) CD4+ T cells in liver. (B) CD8+ T cells in liver. (C) F4/80+ macrophages in liver. (D) Gr-1+ granulocytes in liver. (E) CD4+ T cells in spleen. (F) CD8+ T cells in spleen. (G) F4/80+ macrophages in spleen. *P < 0.05, macrophage in mice of VNP20009 infection at 3 d post infection vs. VNP(phoP/Q)infection at 3 d post infection. (H) Gr-1+ granulocytes in spleen.

Figure 3. Subpopulation analysis of immune cells in liver and spleen of tumor-free mice. Tumor-free mice or tumor-bearing mice were inoculated with VNP20009 and VNP(PhoP/Q−) by intraperitoneal injection. Immune cells in liver and spleen of tumor free mice were determined at 1, 2, and 3 d post infection. (A) CD4+ T cells in liver. (B) CD8+ T cells in liver. (C) F4/80+ macrophages in liver. (D) Gr-1+ granulocytes in liver. (E) CD4+ T cells in spleen. (F) CD8+ T cells in spleen. (G) F4/80+ macrophages in spleen. *P < 0.05, macrophage in mice of VNP20009 infection at 3 d post infection vs. VNP(phoP/Q−)infection at 3 d post infection. (H) Gr-1+ granulocytes in spleen.
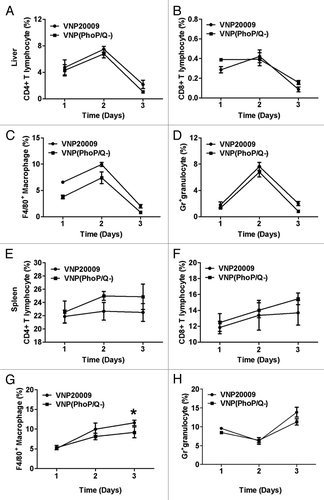
Figure 4. Intracellular survival of VNP(PhoP/Q) in vitro. Raw 264.7 macrophages and tumor cells were incubated with VNP(PhoP/Q) or VNP20009 for 1 h at 37 °C to permit phagocytosis. One hour after infection, gentamicin (25 μg/mL) was added to kill extracellular bacteria. After 3 h of culture at 37 °C, cells were lysed and the titer of bacteria was determined by counting colonies. (A) The number of bacteria in macrophage, *P < 0.05, VNP20009 vs. VNP(PhoP/Q). (B) The number of bacteria in tumor, *P < 0.05, VNP20009 vs. VNP(PhoP/Q).

Figure 4. Intracellular survival of VNP(PhoP/Q−) in vitro. Raw 264.7 macrophages and tumor cells were incubated with VNP(PhoP/Q−) or VNP20009 for 1 h at 37 °C to permit phagocytosis. One hour after infection, gentamicin (25 μg/mL) was added to kill extracellular bacteria. After 3 h of culture at 37 °C, cells were lysed and the titer of bacteria was determined by counting colonies. (A) The number of bacteria in macrophage, *P < 0.05, VNP20009 vs. VNP(PhoP/Q−). (B) The number of bacteria in tumor, *P < 0.05, VNP20009 vs. VNP(PhoP/Q−).
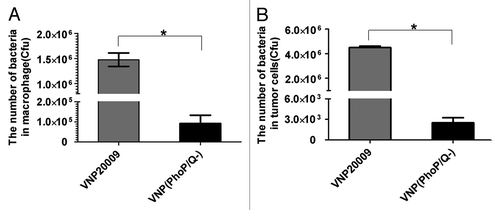
Figure 5. Antitumor effect of VNP(PhoP/Q). 4T1 breast cancer mice per group were injected i.p. with 1 × 10⁴ cfu of VNP20009 and VNP(PhoP/Q), or with PBS at day 6 and 12. Tumor volumes among different groups were compared. Data are presented as mean ± SD. (A) Tumor growth curves. *P < 0.05 for PBS vs. VNP20009 and VNP(PhoP/Q). (B) Tumor doubling time, *P < 0.05 for PBS vs. VNP20009 and VNP(PhoP/Q). (C) Growth delay time,*P < 0.05 for PBS vs. VNP20009 and VNP(PhoP/Q).

Figure 5. Antitumor effect of VNP(PhoP/Q−). 4T1 breast cancer mice per group were injected i.p. with 1 × 10⁴ cfu of VNP20009 and VNP(PhoP/Q−), or with PBS at day 6 and 12. Tumor volumes among different groups were compared. Data are presented as mean ± SD. (A) Tumor growth curves. *P < 0.05 for PBS vs. VNP20009 and VNP(PhoP/Q−). (B) Tumor doubling time, *P < 0.05 for PBS vs. VNP20009 and VNP(PhoP/Q−). (C) Growth delay time,*P < 0.05 for PBS vs. VNP20009 and VNP(PhoP/Q−).

Table 1. Regression analysis for treatment effects on tumor growth for treatment effects on survival

Figure 6. Releasing plasmid effect of VNP(PhoP/Q). 4T1 breast cancer mice per group were injected i.p. with 1 × 10⁴ cfu of VNP20009 and VNP(PhoP/Q) bearing pRNAU6.1 RNA interference vector. Six days post-treatment, frozen tumor sections were prepared and EGFP expression in tumor tissues was analyzed. EGFP expression indicated the shRNA expression ability of interference plasmid in tumor cells. (A) EGFP expression in tumor tissue. (B) EGFP expression in macrophages of tumor tissues. (C) EGFP expression in 4T1 tumor cells of tumor tissues.
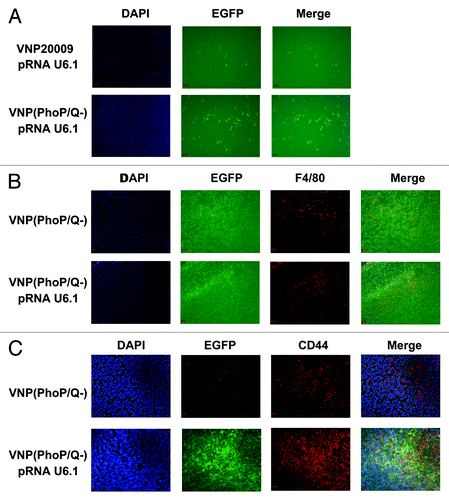
Figure 6. Releasing plasmid effect of VNP(PhoP/Q−). 4T1 breast cancer mice per group were injected i.p. with 1 × 10⁴ cfu of VNP20009 and VNP(PhoP/Q−) bearing pRNAU6.1 RNA interference vector. Six days post-treatment, frozen tumor sections were prepared and EGFP expression in tumor tissues was analyzed. EGFP expression indicated the shRNA expression ability of interference plasmid in tumor cells. (A) EGFP expression in tumor tissue. (B) EGFP expression in macrophages of tumor tissues. (C) EGFP expression in 4T1 tumor cells of tumor tissues.

Reprints and Corporate Permissions

Please note: Selecting permissions does not provide access to the full text of the article, please see our help page How do I view content?

To request a reprint or corporate permissions for this article, please click on the relevant link below:

Academic Permissions

Please note: Selecting permissions does not provide access to the full text of the article, please see our help page How do I view content?

Obtain permissions instantly via Rightslink by clicking on the button below:

If you are unable to obtain permissions via Rightslink, please complete and submit this Permissions form. For more information, please visit our Permissions help page.