634
Views
14
CrossRef citations to date
0
Altmetric
Research Paper

Arsenite promotes intestinal tumor cell proliferation and invasion by stimulating epithelial-to-mesenchymal transition

, , , , , , & show all
Pages 1312-1319 | Received 28 Feb 2014, Accepted 22 Jun 2014, Published online: 10 Jul 2014

Figures & data

Figure 1. Chronic exposure to AS promotes the proliferation of HT-29 cell lines. (A and B) HT-29 cells were exposed to 0 or 15 nM AS for 0, 30, and 60 passages. In the MTT assay, AS increased the HT-29 cell proliferation, especially in AS (60).*P < 0.05; **P < 0.01. (C–E) Similarly, cell cycle analysis suggested that chronic AS treatment accelerated cell re-entering into the S phase.*P < 0.05. (F–I) In soft agar culture, chronic AS exposure increased the soft agar colony formation of the HT-29 cells, especially in AS (60) cell.*P < 0.05; **P < 0.01. (J–M) Chronic AS exposure increases the plate colony formation rate of the HT-29 cells, especially in AS (60) cell. *P < 0.05;**P < 0.01.
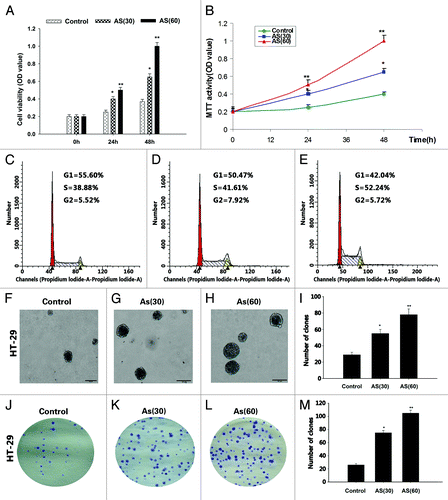
Figure 1. Chronic exposure to AS promotes the proliferation of HT-29 cell lines. (A and B) HT-29 cells were exposed to 0 or 15 nM AS for 0, 30, and 60 passages. In the MTT assay, AS increased the HT-29 cell proliferation, especially in AS (60).*P < 0.05; **P < 0.01. (C–E) Similarly, cell cycle analysis suggested that chronic AS treatment accelerated cell re-entering into the S phase.*P < 0.05. (F–I) In soft agar culture, chronic AS exposure increased the soft agar colony formation of the HT-29 cells, especially in AS (60) cell.*P < 0.05; **P < 0.01. (J–M) Chronic AS exposure increases the plate colony formation rate of the HT-29 cells, especially in AS (60) cell. *P < 0.05;**P < 0.01.

Figure 2. Chronic exposure to AS enhances the migration and invasion of HT-29 cell lines. (A–J) Wound healing rate of HT-29 cell lines at 0, 24, and 48 h after the scratch. AS treated cells, especially the AS (60), migrated much faster than control cells, Note that the wound in AS (60) was nearly closed at 48 h after the scratch (I); bars = 100 μm. (J) is the quantification of (A–I). (K–Q) Representative crystal violet staining images of cells which attached to the bottom of the transwell filter at 24 h after treatment. (K–M)are the lower power images and (N–P)are the higher power images of (K–M). (Q) The intensity of violet staining was measured as absorbance at 560 nm; bars = 100 μm in all panels. All experiments were performed 3 times independently, *P < 0.05; **P < 0.01.
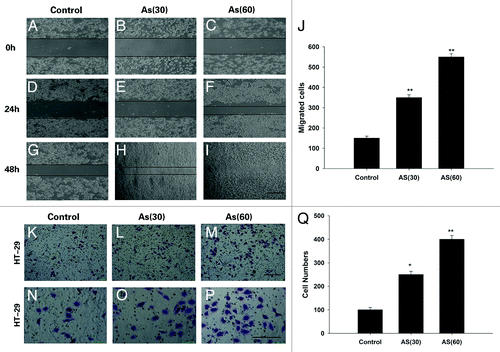
Figure 2. Chronic exposure to AS enhances the migration and invasion of HT-29 cell lines. (A–J) Wound healing rate of HT-29 cell lines at 0, 24, and 48 h after the scratch. AS treated cells, especially the AS (60), migrated much faster than control cells, Note that the wound in AS (60) was nearly closed at 48 h after the scratch (I); bars = 100 μm. (J) is the quantification of (A–I). (K–Q) Representative crystal violet staining images of cells which attached to the bottom of the transwell filter at 24 h after treatment. (K–M)are the lower power images and (N–P)are the higher power images of (K–M). (Q) The intensity of violet staining was measured as absorbance at 560 nm; bars = 100 μm in all panels. All experiments were performed 3 times independently, *P < 0.05; **P < 0.01.

Figure 3. Chronic exposure to AS promotes tumor growth in NOD/SCID mice. (A and B) HT-29 cells were exposed to 0 or 15 nM AS for 0, 30, or 60 passages. Representative images of animals (A) with subcutaneous implanted tumor, and (B) isolated tumors taken on day 40. (C) The subcutaneous tumor growth curves. (D) Quantification of the tumor weight. *P < 0.05; **P < 0.01.
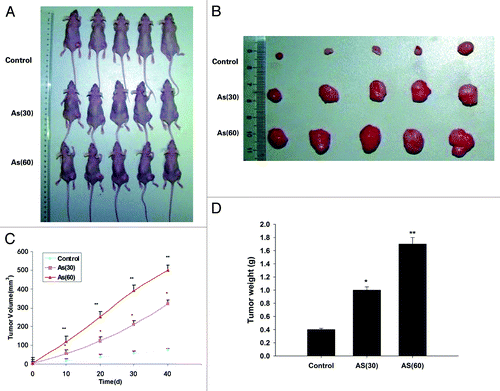
Figure 3. Chronic exposure to AS promotes tumor growth in NOD/SCID mice. (A and B) HT-29 cells were exposed to 0 or 15 nM AS for 0, 30, or 60 passages. Representative images of animals (A) with subcutaneous implanted tumor, and (B) isolated tumors taken on day 40. (C) The subcutaneous tumor growth curves. (D) Quantification of the tumor weight. *P < 0.05; **P < 0.01.

Figure 4. Morphological changes and immunostaining evidences suggested that EMT is involved in the process. (A–C) HT-29 cells were exposed to 0 or 15 nM of arsenic for 0, 30, or 60 passages and typical images with or without AS treatment are shown. Note the morphological shift of HT-29 cells from epithelial-like to mesenchymal-like morphology; Arrows in (A–C) point to the cells with typical morphology. Bars = 100 μm. (D) Relative adhesion ability of HT-29 cells exposed to AS for 0, 30, or 60 passages; *P < 0.05; **P < 0.01. Immuofluorescence staining of E-cadherin (E–M) and vimentin (N–V) in HT-29 cells for the indicated times. (E, H, and K) are green channel that represent E-cadherin staining, and (N, Q, and T) are green channel that represent vimentin staining. (F, I, and L) are blue channel of (E, H, and K), and (O, R, and U) are blue channel of (N, Q, and T), that represents nuclear DNA staining by DAPI, respectively. (G, J, M, P, S, and V) represent merged images; bars = 100 μm.
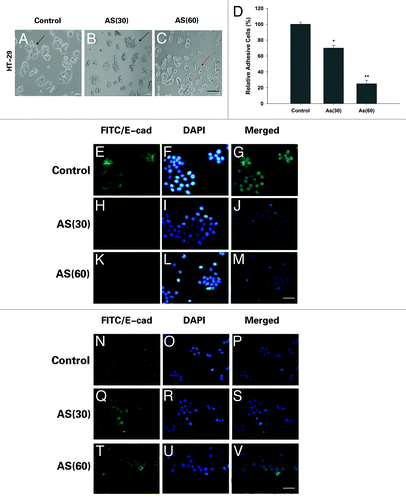
Figure 4. Morphological changes and immunostaining evidences suggested that EMT is involved in the process. (A–C) HT-29 cells were exposed to 0 or 15 nM of arsenic for 0, 30, or 60 passages and typical images with or without AS treatment are shown. Note the morphological shift of HT-29 cells from epithelial-like to mesenchymal-like morphology; Arrows in (A–C) point to the cells with typical morphology. Bars = 100 μm. (D) Relative adhesion ability of HT-29 cells exposed to AS for 0, 30, or 60 passages; *P < 0.05; **P < 0.01. Immuofluorescence staining of E-cadherin (E–M) and vimentin (N–V) in HT-29 cells for the indicated times. (E, H, and K) are green channel that represent E-cadherin staining, and (N, Q, and T) are green channel that represent vimentin staining. (F, I, and L) are blue channel of (E, H, and K), and (O, R, and U) are blue channel of (N, Q, and T), that represents nuclear DNA staining by DAPI, respectively. (G, J, M, P, S, and V) represent merged images; bars = 100 μm.

Figure 5. Acute exposure to AS also induces the EMT-like phenotypical shift. (A) HT-29 cells were exposed to 0 or 15 nM arsenic for 0, 6, 12, and 24 h. Western blot was performed to determine the protein expression levels of E-cadherin, vimentin, MMP-3, MMP-9, β-catenin, and ZEB-1. Note that epithelial marker E-cadherin was inhibited by AS, whereas mesenchymal markers (vimentin, MMP-3, and MMP-9) were upregulated. (B) Quantitation of EMT-related proteins in (A), *P < 0.05; **P < 0.01.
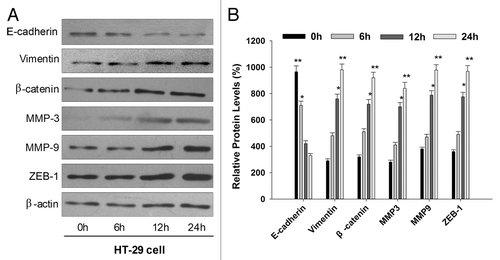
Figure 5. Acute exposure to AS also induces the EMT-like phenotypical shift. (A) HT-29 cells were exposed to 0 or 15 nM arsenic for 0, 6, 12, and 24 h. Western blot was performed to determine the protein expression levels of E-cadherin, vimentin, MMP-3, MMP-9, β-catenin, and ZEB-1. Note that epithelial marker E-cadherin was inhibited by AS, whereas mesenchymal markers (vimentin, MMP-3, and MMP-9) were upregulated. (B) Quantitation of EMT-related proteins in (A), *P < 0.05; **P < 0.01.

Reprints and Corporate Permissions

Please note: Selecting permissions does not provide access to the full text of the article, please see our help page How do I view content?

To request a reprint or corporate permissions for this article, please click on the relevant link below:

Academic Permissions

Please note: Selecting permissions does not provide access to the full text of the article, please see our help page How do I view content?

Obtain permissions instantly via Rightslink by clicking on the button below:

If you are unable to obtain permissions via Rightslink, please complete and submit this Permissions form. For more information, please visit our Permissions help page.