Figures & data
Figure 1. Induction of cell death by bisindole-PBD hybrid. (A) Chemical structure of SAHA and bisindole-PBD hybrid conjugates. Bisindole linked pyrrolo[2,1-c][1,4]benzodiazepine induces cell death in MCF-7 and MDAMB-231 cells. Trypan blue exclusion assay in MCF-7 (B) and in MDAMB-231 (C) showing cell death at 2, 4, and 8 µM. Each experiment was performed thrice. Error bar represents standard deviation from three different experiments. BrdU cell proliferation assay in MCF-7 (D) and MDAMB-231 (E). MCF-7 cells were seeded at a density of 10 000 cells and were grown for 24 h, BrdU was incubated for 5 h at RT followed by treatment 1 µM SAHA (in MCF-7), 5 µM SAHA (in MDAMB-231), 2, 4, and 8 µM 5b for 24 h. The intensity of blue color was measured at 450 nm which is proportional to the amount of BrdU incorporated in proliferating cells. Data presented from three independent experiments. Error bar represents standard deviation from three different experiments
![Figure 1. Induction of cell death by bisindole-PBD hybrid. (A) Chemical structure of SAHA and bisindole-PBD hybrid conjugates. Bisindole linked pyrrolo[2,1-c][1,4]benzodiazepine induces cell death in MCF-7 and MDAMB-231 cells. Trypan blue exclusion assay in MCF-7 (B) and in MDAMB-231 (C) showing cell death at 2, 4, and 8 µM. Each experiment was performed thrice. Error bar represents standard deviation from three different experiments. BrdU cell proliferation assay in MCF-7 (D) and MDAMB-231 (E). MCF-7 cells were seeded at a density of 10 000 cells and were grown for 24 h, BrdU was incubated for 5 h at RT followed by treatment 1 µM SAHA (in MCF-7), 5 µM SAHA (in MDAMB-231), 2, 4, and 8 µM 5b for 24 h. The intensity of blue color was measured at 450 nm which is proportional to the amount of BrdU incorporated in proliferating cells. Data presented from three independent experiments. Error bar represents standard deviation from three different experiments](/cms/asset/7cae0907-f6f4-4a80-9757-1c0cde2195c2/kcbt_a_10929705_f0001.gif)
Figure 2. Exposure to DNA damaging agents leads to increased level of ROS. Induction of ROS in MCF-7 and MDAMB-231 cells after treatment with SAHA (1 and 5 µM) and 5b at 4 µM for 24 h. Treated cells were incubated with carboxy-H2DCFDA for 30 min at 37 °C and ROS were observed by fluorescence microscopy. In both the cell lines there was significant increase of ROS as compared with controls and SAHA treated samples.
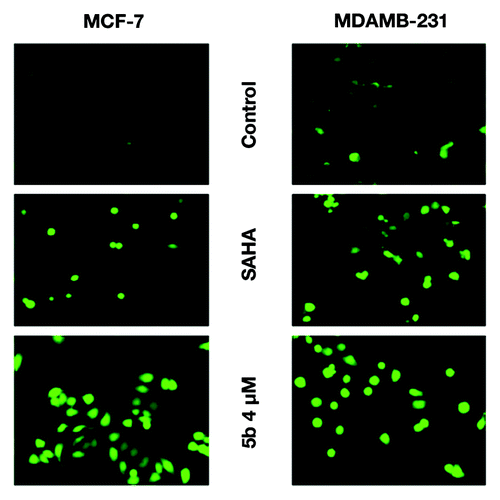
Figure 3. Assessment of mitochondrial membrane potential and induction of apoptosis after compound treatment. (A and B) Mitochondrial membrane potential was measured by JC-1 staining and analyzed by flowcytometry. Cells were grown in 6-well plate at a density of 2 × 10⁵ per well. Treatment was given at 5 µM (in MDAMB-231), 1 µM (MCF-7) concentration of SAHA, 2, 4, and 8 µM 5b for 24 h. After trypsinization, cells were incubated with 10 μg/mL of JC-1 for 20 min at 37 °C. Red/green fluorescence intensity ratio was measured by flow cytometry. (C and D) Western blot analysis of proteins associated with apoptosis. MCF-7 AND MDAMB-231 cell were treated with SAHA (1 µM in MCF-7 and 5 µM in MDAMB-231) and 5b (2, 4, 8 µM) and were incubated for 24 h. Proteins were extracted for western blots analysis with different antibodies. β-actin was used as loading control.
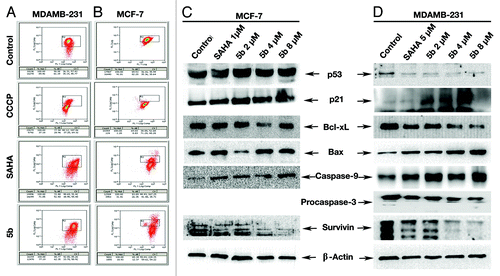
Figure 4. Identification of γ-H2AX foci and γ-H2AX protein expression induced from DSBs. (A) Immunofluorescence studies of γ-H2AX after treatment with compounds. Cells were incubated with 5 µM (in MDAMB-231), 1 µM (MCF-7) concentration of SAHA, or 4 µM of 5b for 24 h. Cells were fixed and processed for immunofluorescence using and γH2AX antibody. Nuclei were counterstained with DAPI. Images were acquired in Olympus confocal laser microscope. (B) Study of phosphorylation of H2AX was performed by western blot analysis. Proteins were extracted from compound treated cells at different concentrations—1 µM SAHA (in MCF-7), 5 µM SAHA (in MDAMB-231), 2, 4, and 8 µM 5b for 24 h—and immunoblot analysis was performed to verify γ-H2AX protein expression after treatment. Error bar represents standard deviation from three different experiments.
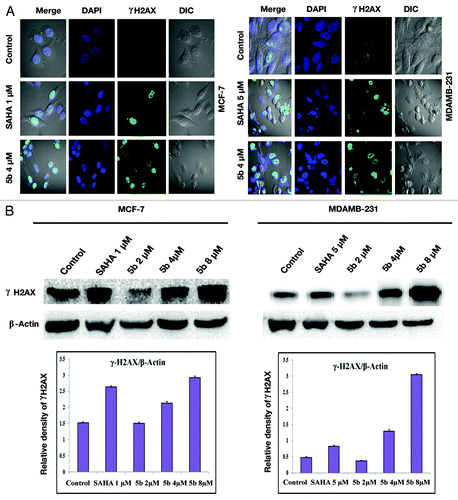
Figure 5. Bisindole linked pyrrolo[2,1-c][1,4]benzodiazepine induces single strand DNA break in both MCF-7 and MDAMB-231 cells. Cells were treated with 1 µM SAHA (in MCF-7), 5 µM SAHA (in MDAMB-231), and 4 µM of 5b for 24 h. DNA damage was determined by the percentage of DNA tail area. Each experiment was performed thrice. Error bar represents standard deviation obtained from three different independent experiments. (A) MCF-7 and (B) MDAMB-231.
![Figure 5. Bisindole linked pyrrolo[2,1-c][1,4]benzodiazepine induces single strand DNA break in both MCF-7 and MDAMB-231 cells. Cells were treated with 1 µM SAHA (in MCF-7), 5 µM SAHA (in MDAMB-231), and 4 µM of 5b for 24 h. DNA damage was determined by the percentage of DNA tail area. Each experiment was performed thrice. Error bar represents standard deviation obtained from three different independent experiments. (A) MCF-7 and (B) MDAMB-231.](/cms/asset/f84c2a89-d552-4a78-a3a3-33ac9dabf9e9/kcbt_a_10929705_f0005.gif)
Figure 6. DNA damage activates ATM and ATR gene expressions. Treatment was given at 5 µM (in MDAMB-231), 1 µM (MCF-7) concentration of SAHA, 2, 4, and 8 µM 5b for 24 h. Total RNA was extracted from treated cells. RT-PCR was conducted using specific primers. PCR products were separated on 1.2% agarose gel electrophoresis and visualized under UV light. GAPDH was used as loading control. Experiment was repeated three times. Error bar represents standard deviation from three different experiments.
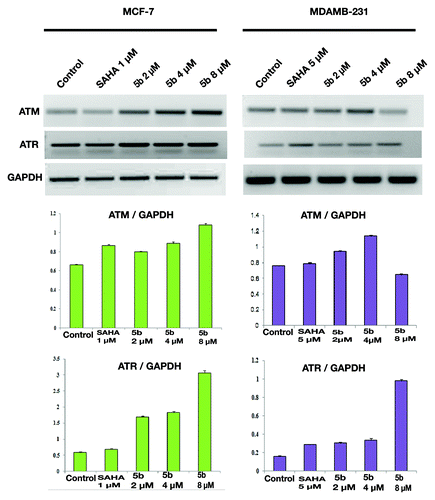
Figure 7. Effect of bisindole-PBD hybrid on DNA damage associated protein. MCF-7 and MDAMB-231 cells were incubated with SAHA and 5b for 24 h. SAHA was administered at 1 µM concentration in MCF-7 and 5 µM concentration in MDAMB-231 cells. 5b was used at 2, 4, and 8 µM concentration. Cell lysates were collected, and protein expression level of Chk2 was determined by Immunoblot analysis. β-actin was used as loading control.
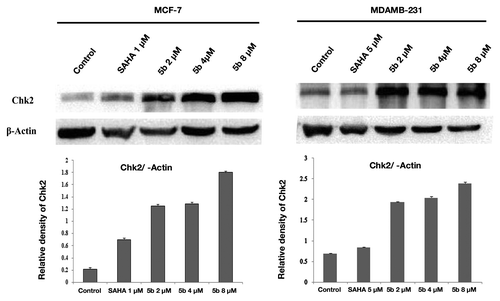
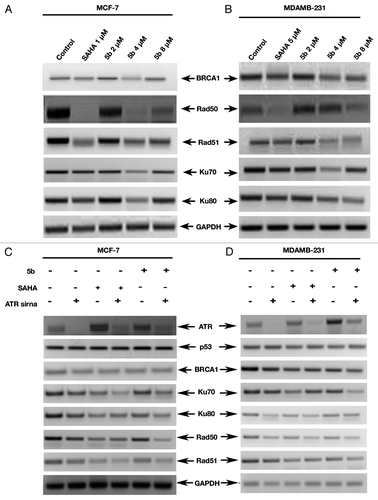
Figure 8. mRNA levels of different DNA repair genes were suppressed by bisindole-PBD hybrid which was independent of ATR expression. (A and B) Expression of DNA repair associated genes was studied by RT-PCR. Treatment was given at 5 µM (in MDAMB-231), 1 µM (MCF-7) concentration of SAHA, and 2, 4, and 8 µM 5b for 24 h. in MCF-7 and MDAMB-231 cells and were incubated for 24 h. Total RNA extraction was done by Trizol method. PCR amplification of DNA repair associated gene (BRCA1, Rad50, Rad51, Ku70, and Ku80) product was observed by agarose gel. (C and D) RT-PCR amplification of DNA repair genes under reduced level of ATR. ATR-specific siRNA transfection was performed to see the expression pattern of DNA repair genes.