Figures & data
Figure 1. PI3K signaling and inhibition PI3K-AKT-mTOR activation leads to regulation of proliferation, apoptosis, angiogenesis and other key cellular processes, through the transcription of hundreds of target genes by NFκB. Inactive NFκB is bound by its inhibitor IκBα in the cytoplasm, until activation leads to dissociation of the two proteins and proteosomal degradation of IκBα. NFκB is then free to translocate to the nucleus where it acts as a transcription factor. One of NFκB’s many target genes is IκBα, which removes NFκB from the nucleus, returning it to its original inactive form in the cytoplasm. GDC-0980 is a dual PI3K–mTOR inhibitor. DHMEQ is an inhibitor of NFκB translocation to the nucleus. AKT, Protein Kinase B; IκBa, Nuclear factor of kappa light polypeptide gene enhancer in B-cellsinhibitor, α; mTOR, mammalian target of rapamycin; NFκB, Nuclear factor kappa-light-chain-enhancer ofactivated B cells; PI3K, Phosphatidylinositide 3-kinase.
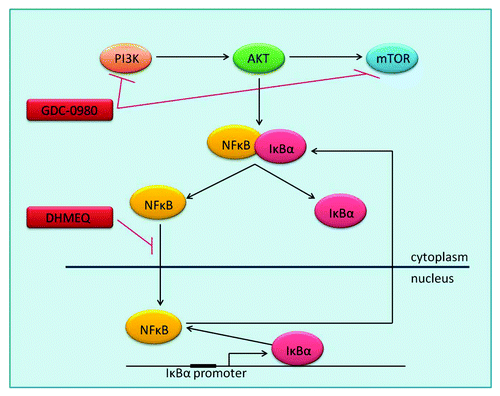
Figure 2. NFKBIA is more highly expressed in H460CR cells than H460 cells An RT2 profiler PI3K-Akt pathway array was performed to compare gene expression in H460 (cisplatin-sensitive) and H460CR (cisplatin-resistant) cell lines. (A) A heat map was constructed using SABiosciences online software, corresponding to . Four genes were upregulated greater than 2-fold and 11 genes were downregulated greater than 2-fold in cisplatin-resistant cells compared with parent cells. Position E01 corresponds to an increase in NFKBIA. (B) Upregulation of NFKBIA in H460CR cells was validated by QRTPCR, using NFKBIA and ACTB specific primers, in three independent experiments. Fold regulation is shown for NFKBIA in H460CR cells compared with H460PT cells, calculated via the ΔΔCt method. ***P < 0.001. H460PT, H460 parent cells; H460CR, H460 cisplatin-resistant cells.
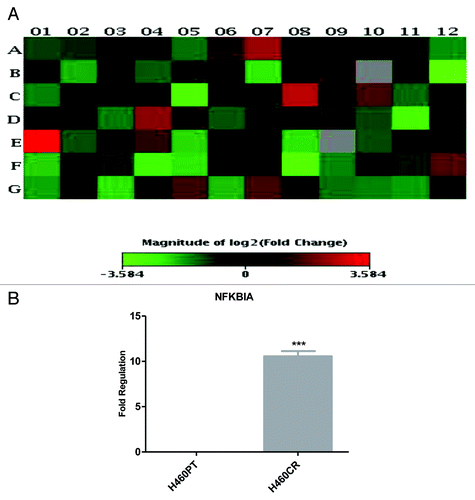
Figure 3. IkBa is more highly expressed in H460CR cells than H460parent cells. (A) Immunofluorescence image: H460 parent untreated cells were stained with IκBα primary antibody and Alexa Fluor488 conjugated secondary antibody (green). Cells were also stained with Höechst nuclear stain (blue). Alexa Fluor conjugated secondary antibody (green) indicates IκBα expression in the cytoplasm and peri-nuclear space. (B) Immunofluorescence image: H460CR untreated cells were stained and imaged as in (A). The increased intensity of green staining here indicates the presence of more IκBα here than in H460 cells. (C) Immunofluorescence analysis: Cells were either left untreated (as in [A and B]) or pretreated with TNAα (25 ng/mL) for 20 min. Cells were imaged using High Content Analysis. Each treatment was performed in triplicate and three independent experiments were performed. Cell intensity (amount of IκBα fluorescence) was measured in the nucleus and the cytoplasm using HCA software. (D) H460 and A549 parent and cisplatin-resistant cell protein samples were run on an SDS-PAGE gel and analyzed by western blot three independent times for expression of IκBα and αβTubulin. (E) Densitometry analysis was performed using ImageJ software to compare expression of IκBα between H460 and A549 parent and cisplatin-resistant cells. *P < 0.05 ***P < 0.001. H460PT, H460 parent cells; H460CR, H460 cisplatin-resistant cells.
![Figure 3. IkBa is more highly expressed in H460CR cells than H460parent cells. (A) Immunofluorescence image: H460 parent untreated cells were stained with IκBα primary antibody and Alexa Fluor488 conjugated secondary antibody (green). Cells were also stained with Höechst nuclear stain (blue). Alexa Fluor conjugated secondary antibody (green) indicates IκBα expression in the cytoplasm and peri-nuclear space. (B) Immunofluorescence image: H460CR untreated cells were stained and imaged as in (A). The increased intensity of green staining here indicates the presence of more IκBα here than in H460 cells. (C) Immunofluorescence analysis: Cells were either left untreated (as in [A and B]) or pretreated with TNAα (25 ng/mL) for 20 min. Cells were imaged using High Content Analysis. Each treatment was performed in triplicate and three independent experiments were performed. Cell intensity (amount of IκBα fluorescence) was measured in the nucleus and the cytoplasm using HCA software. (D) H460 and A549 parent and cisplatin-resistant cell protein samples were run on an SDS-PAGE gel and analyzed by western blot three independent times for expression of IκBα and αβTubulin. (E) Densitometry analysis was performed using ImageJ software to compare expression of IκBα between H460 and A549 parent and cisplatin-resistant cells. *P < 0.05 ***P < 0.001. H460PT, H460 parent cells; H460CR, H460 cisplatin-resistant cells.](/cms/asset/a9058b05-33dc-458c-8175-fa667111c6d1/kcbt_a_10929841_f0003.gif)
Figure 4. NFKBIA Sequence Trace. (A) Exons 3, 4, and 5 of IκBα were amplified via nested PCR from H460PT and H460CR RNA. PCR products were visualized on a 1% agarose gel, and compared with a 100 bp DNA ladder (Fermentas). (B) Amplicons were sequenced using the AB3130 sequencer. Sequence trace files were obtained for each exon in each cell line, an example of which is shown here. No double peaks were observed in any trace file. (C) Forward and reverse sequences were compared against wild-type sequences for each NFKBIA exon in both cell lines using the basic local alignment search tool for nucleotides (BLASTN). No discrepancies were identified between our sequences and wild-type sequences. A sample sequence of H460 NFKBIA exon 3 is shown here, aligned with wild type IκBα exon 3. H460PT, H460 parent cells; H460CR, H460 cisplatin-resistant cells.
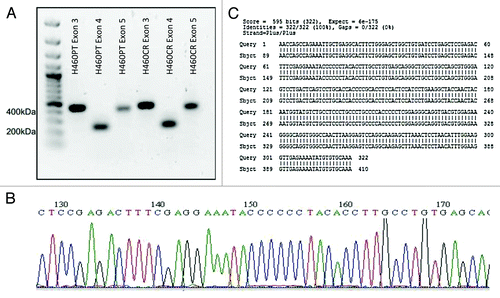
Figure 5. The effects of GDC-0980 treatment on proliferation and cell viability in H460 parent and cisplatin-resistant cells. (A) H460 and parent and cisplatin-resistant cells were treated in triplicate at noted concentrations of GDC-0980 for 72 h. Cells were analyzed via BrdU assay (n = 3). Percentage proliferation is shown here. (B) Sample image: Cells were stained with Höechst blue nuclear stain, mitotracker red mitochondrial stain and phalloidin green F-actin stain, and imaged using the In Cell Analyzer 1000. (C) H460 and parent and cisplatin-resistant cells were treated in triplicate at noted concentrations of GDC-0980 for 48 h. Eight fields were imaged per well at 10× magnification using the In Cell Analyzer 1000. (D) Images from (C) were analyzed using In Cell software which identified cell count automatically from nuclear staining. *P < 0.05 **P < 0.005 ***P < 0.001. H460PT, H460 parent cells; H460CR, H460 cisplatin-resistant cells
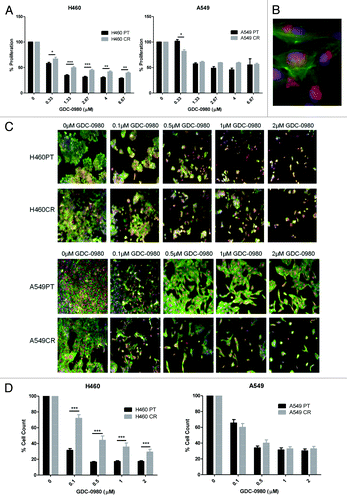
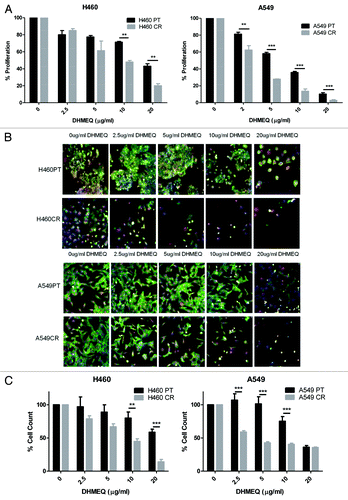
Figure 6. The effects of DHMEQ treatment on proliferation and cell viability in H460 parent and cisplatin-resistant cells. (A) H460 and parent and cisplatin-resistant cells were treated in triplicate at noted concentrations of DHMEQ for 72 h. Cells were analyzed via BrdU assay (n = 3). Percentage proliferation is shown here. (B) H460 and parent and cisplatin-resistant cells were treated in triplicate at noted concentrations of DHMEQ for 48 h. Cells were stained with Höechst blue nuclear stain, mitotracker red mitochondrial stain and phalloidin green F-actin stain, and imaged using the In Cell Analyzer 1000. Eight fields were imaged per well at 10x magnification. (C) Images from (B) were analyzed using In Cell software which identified cell count automatically from nuclear staining. *P < 0.05 **P < 0.005 ***P < 0.001 H460PT: H460 parent cells H460CR: H460 cisplatin-resistant cells.
