1,306
Views
5
CrossRef citations to date
0
Altmetric
Research Paper

Dissecting the roles of E1A and E1B in adenoviral replication and RCAd-enhanced RDAd transduction efficacy on tumor cells

, , , &
Pages 1358-1366 | Received 05 Jun 2014, Accepted 06 Jul 2014, Published online: 14 Jul 2014

Figures & data

Figure 1. RCAd enhanced RDAd-carried GFP expression in cancer cells. The representative pictures of GFP expression. The different type of tumor cells were infected with 25 MOI of Ad-EGFP alone or co-infected with Ad-EGFP (25 MOI) and different RCAd (10 MOI) and the pictures were taken by epi-fluorescence microscopy (A). FACS analysis of GFP expression. The NCI-H460 cells were infected with different MOI of AdGFP (25, 50, and 100 MOI) and co-infected with Ad-EGFP (25 MOI) and different RCAd (2, 5, and 10 MOI). The mean fluorescent intensity of GFP was analyzed by FACS 72 h after infection. Data were average of 3 individual wells for each viral vector infection and at least 3 times of infection (B). *P < 0.05, **P < 0.01, ***P < 0.001.
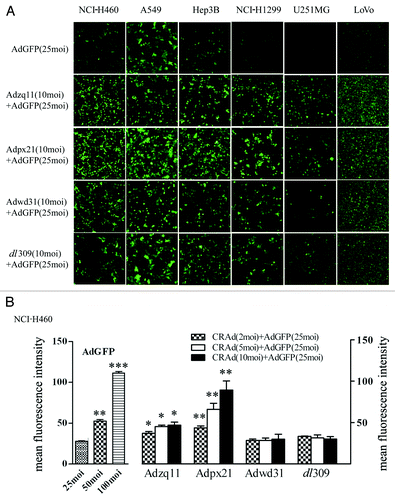
Figure 1. RCAd enhanced RDAd-carried GFP expression in cancer cells. The representative pictures of GFP expression. The different type of tumor cells were infected with 25 MOI of Ad-EGFP alone or co-infected with Ad-EGFP (25 MOI) and different RCAd (10 MOI) and the pictures were taken by epi-fluorescence microscopy (A). FACS analysis of GFP expression. The NCI-H460 cells were infected with different MOI of AdGFP (25, 50, and 100 MOI) and co-infected with Ad-EGFP (25 MOI) and different RCAd (2, 5, and 10 MOI). The mean fluorescent intensity of GFP was analyzed by FACS 72 h after infection. Data were average of 3 individual wells for each viral vector infection and at least 3 times of infection (B). *P < 0.05, **P < 0.01, ***P < 0.001.

Figure 2. Virus replication and oncolytic effect of RCAd. The cancer cell lines NCI-H460, A549, Hep3B, NCI-H1299, and U251MG were infected with 10 MOI of different RCAd, wild-type adenovirus dl309 was used as a control. The cell lysates were prepared at 72 h and viral titers were measured by plaque-forming assay. The titer values are shown as mean ± SD from triplicates (A). All cancer cells mentioned above were infected with different RCAd at 10, 25, 50, 100, and 500 MOI respectively. Cell viability was measured using CCK-8 assay 7 d post-infection. Each infection were performed in 5 wells and repeated 3 times. Data are shown as the mean ± SD and compared with AdGFP alone (B). *P < 0.05, **P < 0.01, ***P < 0.001.
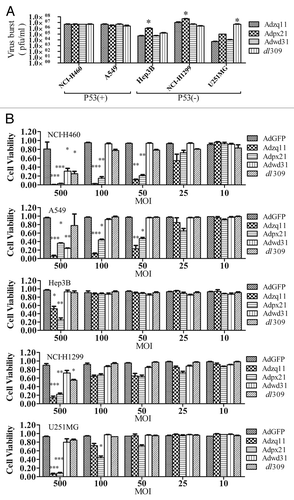
Figure 2. Virus replication and oncolytic effect of RCAd. The cancer cell lines NCI-H460, A549, Hep3B, NCI-H1299, and U251MG were infected with 10 MOI of different RCAd, wild-type adenovirus dl309 was used as a control. The cell lysates were prepared at 72 h and viral titers were measured by plaque-forming assay. The titer values are shown as mean ± SD from triplicates (A). All cancer cells mentioned above were infected with different RCAd at 10, 25, 50, 100, and 500 MOI respectively. Cell viability was measured using CCK-8 assay 7 d post-infection. Each infection were performed in 5 wells and repeated 3 times. Data are shown as the mean ± SD and compared with AdGFP alone (B). *P < 0.05, **P < 0.01, ***P < 0.001.

Figure 3. RCAd enhanced AdGFP transduction in tumor in vivo. A total of 5 × 10⁶ NCI-H460 cells were injected subcutaneously into both hind limbs of Balb/C nude mice. When the tumor size reached 10 mm in diameter, animals were divided into 3 groups (n = 3). A total of 5 × 10⁷ RCAd plus 1 × 10⁸ AdGFP were injected into the tumor on the right hind limb, while about 1 × 10⁸ AdGFP alone were injected into the tumor on the left hind limb as control. Forty-eight hours later, in vivo imaging was performed by NightOwl LB 981 Molecular Imaging System (Berthold Technologies) (A). Comparison of fluorescence intensity in NCI-H460 tumors, data are shown as ratio of RCAd plus Ad-GFP (right leg) over AdGFP alone (left leg) (B).
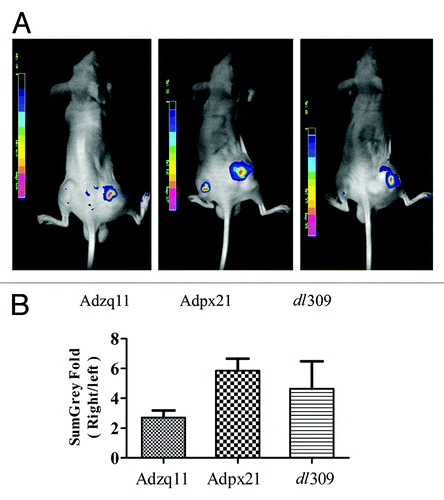
Figure 3. RCAd enhanced AdGFP transduction in tumor in vivo. A total of 5 × 10⁶ NCI-H460 cells were injected subcutaneously into both hind limbs of Balb/C nude mice. When the tumor size reached 10 mm in diameter, animals were divided into 3 groups (n = 3). A total of 5 × 10⁷ RCAd plus 1 × 10⁸ AdGFP were injected into the tumor on the right hind limb, while about 1 × 10⁸ AdGFP alone were injected into the tumor on the left hind limb as control. Forty-eight hours later, in vivo imaging was performed by NightOwl LB 981 Molecular Imaging System (Berthold Technologies) (A). Comparison of fluorescence intensity in NCI-H460 tumors, data are shown as ratio of RCAd plus Ad-GFP (right leg) over AdGFP alone (left leg) (B).

Figure 4. RCAd enhanced AdIL2 transduction inhibited tumor growth. Human xenograft tumors were established by subcutaneous injection of approximately 1 × 10⁷ NCI-H460 tumor cells into the right hind limbs of mice. When tumors reached 5 mm in diameter, mice were randomly divided into 3 groups, with 8 mice in each group. The injection of AdIL2 (5 × 10⁷ pfu) alone or AdIL2 (5 × 10⁷ pfu) plus Adpx21 (1 × 10⁷ pfu) significantly inhibited tumor growth in comparison with saline injected tumors (A). In another set, 72 h after virus injection mice were sacrificed and the tumor tissues were excised and homogenized in PBS (n = 4). IL2 in the supernatant were measured by ELISA. The tumors received Adpx21 plus AdIL2 had increased IL2 expression than that received AdIL2 alone (B). Data are shown as the mean ± SD. *P < 0.05.
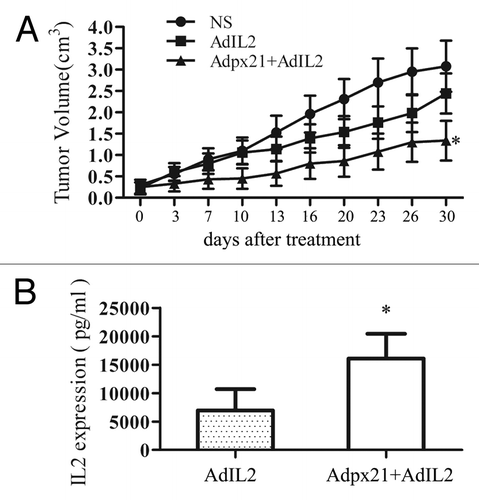
Figure 4. RCAd enhanced AdIL2 transduction inhibited tumor growth. Human xenograft tumors were established by subcutaneous injection of approximately 1 × 10⁷ NCI-H460 tumor cells into the right hind limbs of mice. When tumors reached 5 mm in diameter, mice were randomly divided into 3 groups, with 8 mice in each group. The injection of AdIL2 (5 × 10⁷ pfu) alone or AdIL2 (5 × 10⁷ pfu) plus Adpx21 (1 × 10⁷ pfu) significantly inhibited tumor growth in comparison with saline injected tumors (A). In another set, 72 h after virus injection mice were sacrificed and the tumor tissues were excised and homogenized in PBS (n = 4). IL2 in the supernatant were measured by ELISA. The tumors received Adpx21 plus AdIL2 had increased IL2 expression than that received AdIL2 alone (B). Data are shown as the mean ± SD. *P < 0.05.

Figure 5. Differential effect of different element of E1 genes on AdGFP replication. SMMC7721, NCI-H460, and A549 cells grown on 6-well plates were transfected with 2 µg of plasmid DNAs using lipofectamine 2000, empty vector pZap was used as control. Twenty-four hours after transfection, cells were infected with 10 MOI of AdGFP. Four hours later AdGFP were removed and cells were washed 3 times using PBS and cultured with normal medium. The representative pictures of GFP expression were taken by epi-fluorescence microscopy 24 h later after infection (A). A summary of FACS analysis for GFP expression in cells mentioned above (B). GFP DNA detected by quantitative PCR (C). GFP mRNA detected by quantitative RT-PCR (D). E1a mRNA detected by quantitative RT-PCR (E).
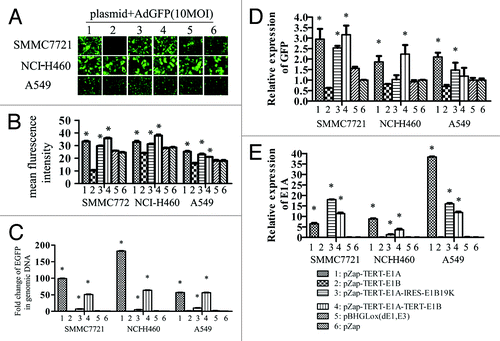
Figure 5. Differential effect of different element of E1 genes on AdGFP replication. SMMC7721, NCI-H460, and A549 cells grown on 6-well plates were transfected with 2 µg of plasmid DNAs using lipofectamine 2000, empty vector pZap was used as control. Twenty-four hours after transfection, cells were infected with 10 MOI of AdGFP. Four hours later AdGFP were removed and cells were washed 3 times using PBS and cultured with normal medium. The representative pictures of GFP expression were taken by epi-fluorescence microscopy 24 h later after infection (A). A summary of FACS analysis for GFP expression in cells mentioned above (B). GFP DNA detected by quantitative PCR (C). GFP mRNA detected by quantitative RT-PCR (D). E1a mRNA detected by quantitative RT-PCR (E).

Figure 6. A schematic diagram of replication competent adenovirus constructed in this study. E1a-P, E1a promoter; TERT-P, the telomerase (TERT) promoter; E1a and E1b, early E1 genes of the adenovirus; IRES, internal ribosome entry site; E1b19k, gene expresses E1b-19 kDa protein; E1b55k, gene expressing E1b-55 kDa protein (A). Confirmation of E1A, E1B-19 kDa, and E1B-55 kDa protein expression by western blot. NCI-H460 cancer cells were infected with different adenoviruses at a 10 MOI (pfu/cell) for 48 h and then the cell lysates were analyzed by western blot. GAPDH (36 kDa) was used as control (B).
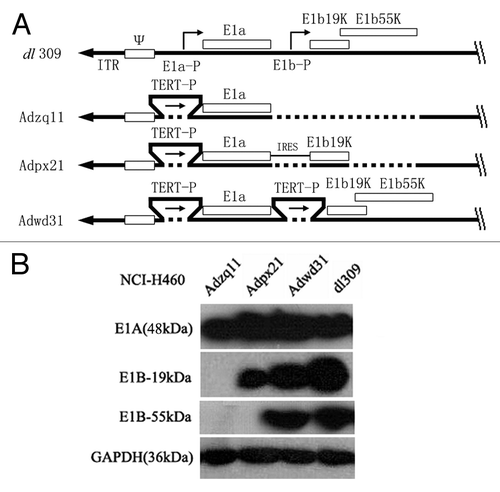
Figure 6. A schematic diagram of replication competent adenovirus constructed in this study. E1a-P, E1a promoter; TERT-P, the telomerase (TERT) promoter; E1a and E1b, early E1 genes of the adenovirus; IRES, internal ribosome entry site; E1b19k, gene expresses E1b-19 kDa protein; E1b55k, gene expressing E1b-55 kDa protein (A). Confirmation of E1A, E1B-19 kDa, and E1B-55 kDa protein expression by western blot. NCI-H460 cancer cells were infected with different adenoviruses at a 10 MOI (pfu/cell) for 48 h and then the cell lysates were analyzed by western blot. GAPDH (36 kDa) was used as control (B).

Reprints and Corporate Permissions

Please note: Selecting permissions does not provide access to the full text of the article, please see our help page How do I view content?

To request a reprint or corporate permissions for this article, please click on the relevant link below:

Academic Permissions

Please note: Selecting permissions does not provide access to the full text of the article, please see our help page How do I view content?

Obtain permissions instantly via Rightslink by clicking on the button below:

If you are unable to obtain permissions via Rightslink, please complete and submit this Permissions form. For more information, please visit our Permissions help page.