1,865
Views
29
CrossRef citations to date
0
Altmetric
Research Paper

Identification of cancer stem cells and a strategy for their elimination

, , , , , , , , , , , , , , , , , , , , , , & show all
Pages 1378-1394 | Received 20 Jun 2014, Accepted 07 Jul 2014, Published online: 17 Jul 2014

Figures & data

Figure 1. Internalization of exogenous dsDNA by ascites cells of mouse Krebs-2 tumor. (A) Fluorescence analysis of TAMRA-labeled Alu DNA and TAMRA-dUTP precursor by ascites form of Krebs-2 tumor cells. Notably, ascites cells fail to incorporate TAMRA-dUTP. Bar corresponds to 50 µm. (B) Same as above, zoom-in, bars correspond to 10 µm. Top and side views of a TAMRA-positive cell are shown on the bottom right panel. (C) Fluorescence analysis of total human TAMRA-labeled DNA fragments (0.2–6 kb) internalized by ascites Krebs-2 tumor cells. Bars correspond to 10 µm. (D) Molecular analysis of dsDNA internalization by Krebs-2 ascites cells. Upper panel: αP32-labeled PCR-amplified GFP fragment was used to directly monitor DNA internalization by ascites cells (probe size is shown on the *GFP lane), M, DNA weight marker; CP+DNA, Krebs-2 ascites cells collected 18 h post CP injection and incubated with labeled DNA (for 1, 2, 4 and 8 h); DNA, Krebs-2 ascites cells from CP-untreated mice and incubated with labeled DNA (for 1, 2, 4 and 8 h); ВMC, bone marrow cells from an intact mouse incubated with labeled DNA (for 1, 2, 4 and 8 h). Lower panel: Non-labeled linearized pEGFP-N1/HindIII DNA was used to detect internalization of exogenous DNA by cells. Internalization was visualized by Southern blot using 32P-labeled GFP DNA as a probe. Treatments and collection timepoints are the same as on the upper panel. Southern blot and gel images are shown. Bone marrow cells were used as a positive control, where DNA internalization is well-documented.Citation15 (E) FACS profiles showing dsDNA internalization upon increasing concentration of the labeled substrate in the medium. Graph summarizing FACS data are shown below. (F) Flow cytometry analysis of dynamics of Alu-TAMRA dsDNA internalization in course of incubation with Krebs-2 tumor cells. Data shown on the FACS plots are converted into a graph format (bottom right).
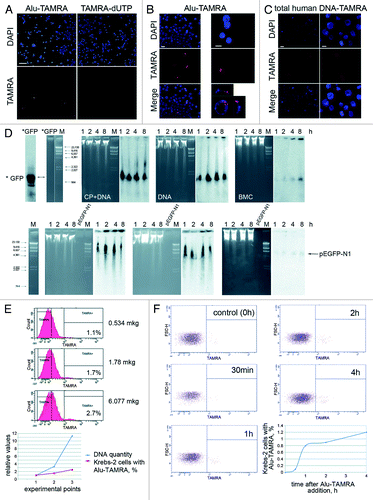
Figure 1. Internalization of exogenous dsDNA by ascites cells of mouse Krebs-2 tumor. (A) Fluorescence analysis of TAMRA-labeled Alu DNA and TAMRA-dUTP precursor by ascites form of Krebs-2 tumor cells. Notably, ascites cells fail to incorporate TAMRA-dUTP. Bar corresponds to 50 µm. (B) Same as above, zoom-in, bars correspond to 10 µm. Top and side views of a TAMRA-positive cell are shown on the bottom right panel. (C) Fluorescence analysis of total human TAMRA-labeled DNA fragments (0.2–6 kb) internalized by ascites Krebs-2 tumor cells. Bars correspond to 10 µm. (D) Molecular analysis of dsDNA internalization by Krebs-2 ascites cells. Upper panel: αP32-labeled PCR-amplified GFP fragment was used to directly monitor DNA internalization by ascites cells (probe size is shown on the *GFP lane), M, DNA weight marker; CP+DNA, Krebs-2 ascites cells collected 18 h post CP injection and incubated with labeled DNA (for 1, 2, 4 and 8 h); DNA, Krebs-2 ascites cells from CP-untreated mice and incubated with labeled DNA (for 1, 2, 4 and 8 h); ВMC, bone marrow cells from an intact mouse incubated with labeled DNA (for 1, 2, 4 and 8 h). Lower panel: Non-labeled linearized pEGFP-N1/HindIII DNA was used to detect internalization of exogenous DNA by cells. Internalization was visualized by Southern blot using 32P-labeled GFP DNA as a probe. Treatments and collection timepoints are the same as on the upper panel. Southern blot and gel images are shown. Bone marrow cells were used as a positive control, where DNA internalization is well-documented.Citation15 (E) FACS profiles showing dsDNA internalization upon increasing concentration of the labeled substrate in the medium. Graph summarizing FACS data are shown below. (F) Flow cytometry analysis of dynamics of Alu-TAMRA dsDNA internalization in course of incubation with Krebs-2 tumor cells. Data shown on the FACS plots are converted into a graph format (bottom right).

Figure 2. Analysis of tumorigenic properties of TAMRA-positive cells. (A) Overlap between CD34+ and TAMRA+ ascites cell populations: 1, cell cycle profile for Krebs-2 ascites cells; 2, FACS analysis confirming the presence of CD34+ and TAMRA+ cells in the same sample of ascites; 3 and 4, FACS analysis of TAMRA and/or FITC positive cells. Vast majority of CD34+ cells are also TAMRA+ (3), whereas about half of TAMRA+ cells are also CD34+ (4); 5, cytofluorescence analysis showing co-staining of ascites Krebs-2 cells in a sample used for FACS profiling. Bars correspond to 10 µm. (B) Analysis of engraftment potential of TAMRA+, TAMRA cells. 1, The plots illustrate the dynamics of tumor formation (percentage of mice with detectable tumors); 2, FACS profile of Krebs-2 ascites cells following incubation with TAMRA-DNA; 3, FACS profile of an enriched sample of TAMRA positive cells to be used for engraftment. (C) Analysis of engraftment potential of CD34+ and CD34 cells. 1, The plots illustrate the dynamics of tumor formation (percentage of mice with detectable tumors); 2, FACS analysis of Krebs-2 ascites cell samples after incubation with isotype control (left) and CD34 specific antibodies (right). (D) 1–6 spatial organization of TAMRA-positive cells in solid form of Krebs-2 tumor. Bars correspond to 20 µm (1–4) and 10 µm (5). Well-defined foci of cells internalizing TAMRA-DNA. Each focus includes tens to hundreds of cells. 7, Histology analysis of a solid form of Krebs-2 tumor. Tumor tissue displays pronounced cellular atypia and aggressive growth pattern. Stretches of tumor cells (arrows) are interlaced with the fragments of muscle fibers. 8 and 9, FACS quantification of TAMRA positive cells in a solid form of Krebs-2 tumor, bar corresponds to 20 µm. (E) Spatial organization of TAMRA positive cells in spleen and liver. 1 and 2, upon co-incubation of tissue samples with TAMRA-labeled DNA, followed by cryosectioning and confocal imaging; 3 and 4, upon physical homogenization of the tumor down to individual cells, co-incubation with TAMRA-labeled DNA and FACS analysis. Spleen samples lack any cells showing TAMRA-DNA internalization. Single TAMRA positive cells were detected in the liver. Bars correspond to 50 µm. (F) 3D reconstruction of a solid form of Krebs-2 tumor showing localization of TAMRA-DNA internalizing cell clusters.
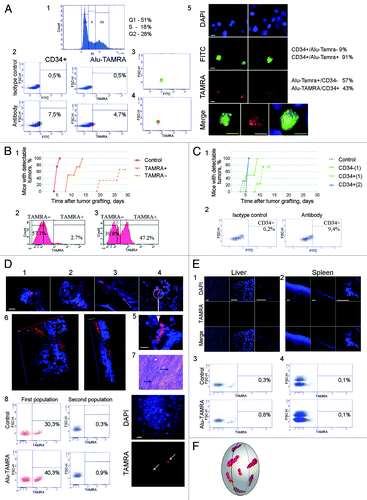
Figure 2. Analysis of tumorigenic properties of TAMRA-positive cells. (A) Overlap between CD34+ and TAMRA+ ascites cell populations: 1, cell cycle profile for Krebs-2 ascites cells; 2, FACS analysis confirming the presence of CD34+ and TAMRA+ cells in the same sample of ascites; 3 and 4, FACS analysis of TAMRA and/or FITC positive cells. Vast majority of CD34+ cells are also TAMRA+ (3), whereas about half of TAMRA+ cells are also CD34+ (4); 5, cytofluorescence analysis showing co-staining of ascites Krebs-2 cells in a sample used for FACS profiling. Bars correspond to 10 µm. (B) Analysis of engraftment potential of TAMRA+, TAMRA− cells. 1, The plots illustrate the dynamics of tumor formation (percentage of mice with detectable tumors); 2, FACS profile of Krebs-2 ascites cells following incubation with TAMRA-DNA; 3, FACS profile of an enriched sample of TAMRA positive cells to be used for engraftment. (C) Analysis of engraftment potential of CD34+ and CD34− cells. 1, The plots illustrate the dynamics of tumor formation (percentage of mice with detectable tumors); 2, FACS analysis of Krebs-2 ascites cell samples after incubation with isotype control (left) and CD34 specific antibodies (right). (D) 1–6 spatial organization of TAMRA-positive cells in solid form of Krebs-2 tumor. Bars correspond to 20 µm (1–4) and 10 µm (5). Well-defined foci of cells internalizing TAMRA-DNA. Each focus includes tens to hundreds of cells. 7, Histology analysis of a solid form of Krebs-2 tumor. Tumor tissue displays pronounced cellular atypia and aggressive growth pattern. Stretches of tumor cells (arrows) are interlaced with the fragments of muscle fibers. 8 and 9, FACS quantification of TAMRA positive cells in a solid form of Krebs-2 tumor, bar corresponds to 20 µm. (E) Spatial organization of TAMRA positive cells in spleen and liver. 1 and 2, upon co-incubation of tissue samples with TAMRA-labeled DNA, followed by cryosectioning and confocal imaging; 3 and 4, upon physical homogenization of the tumor down to individual cells, co-incubation with TAMRA-labeled DNA and FACS analysis. Spleen samples lack any cells showing TAMRA-DNA internalization. Single TAMRA positive cells were detected in the liver. Bars correspond to 50 µm. (F) 3D reconstruction of a solid form of Krebs-2 tumor showing localization of TAMRA-DNA internalizing cell clusters.

Figure 3. Internalization of Alu fragment DNA by human glioma cells. (A) Phase-contrast image of adherent cell fraction and neurospheres from human glioblastoma cell culture. (B) Fluorescence microscopy analysis of TAMRA-labeled DNA internalization by glioblastoma cells. Background images show the magnitude of non-specific autofluorescence. Notably, labeled DNA probe displays specific nuclear localization in the cells from neurosphere fraction, and only a single specific positive signal was observed across all adherent cells analyzed. (C) Cytofluorescence analysis of TAMRA-labeled DNA in freely-floating neurosphere cell cultures. Several neurospheres are shown. Bottom image represents cytospinned neurospheres stained with DAPI. (D) 3D reconstituted image of a neurosphere with cells internalizing TAMRA-labeled dsDNA (arrowheads). (E) Visualization of GFP expression in neurospheres that have internalized pEGFP-N1 plasmid. As a control, we provide the fluorescence image of a neurosphere (1) and dying glioma cells (2) neither of which were incubated with plasmid DNA. Unless specified otherwise, bars correspond to 50 µm.
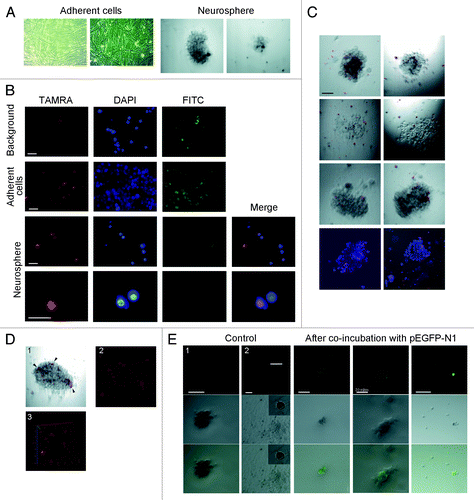
Figure 3. Internalization of Alu fragment DNA by human glioma cells. (A) Phase-contrast image of adherent cell fraction and neurospheres from human glioblastoma cell culture. (B) Fluorescence microscopy analysis of TAMRA-labeled DNA internalization by glioblastoma cells. Background images show the magnitude of non-specific autofluorescence. Notably, labeled DNA probe displays specific nuclear localization in the cells from neurosphere fraction, and only a single specific positive signal was observed across all adherent cells analyzed. (C) Cytofluorescence analysis of TAMRA-labeled DNA in freely-floating neurosphere cell cultures. Several neurospheres are shown. Bottom image represents cytospinned neurospheres stained with DAPI. (D) 3D reconstituted image of a neurosphere with cells internalizing TAMRA-labeled dsDNA (arrowheads). (E) Visualization of GFP expression in neurospheres that have internalized pEGFP-N1 plasmid. As a control, we provide the fluorescence image of a neurosphere (1) and dying glioma cells (2) neither of which were incubated with plasmid DNA. Unless specified otherwise, bars correspond to 50 µm.

Figure 4. Pathomorphology, histofluorescence and PCR analysis of glioblastoma xenotransplants from brains of NOD/SCID mice. (A) Brain MRI of experimental animals. Upper panel: Serial mouse brain MRI sections on day 28 after glioma adherent cell fraction engraftment. Middle panel: Serial mouse brain MRI sections on day 28 after glioma neurosphere cell injection. Lower panel: Serial mouse brain manganese-enhanced MRI sections (same animal as above). Arrows indicate localization of the growing transplant. (B) Histology analysis of paraffin sections of glioma transplants and original glioblastoma biopsy. Black arrows on mouse brain sections indicate graft cells, and white arrows show normal brain tissue (mouse 1). Tumor displays surface localization and proliferation in interlobar gyri (central sulcus in this case). HE staining, 200× magnification. Mouse 2: large tumor lining the brain ventricle wall. Central part of the tumor is infiltrated with inflammatory cells (mostly granulocytes). Black arrows point to the cell infiltrate; white arrows show normal brain tissue. HE staining, 400× magnification. Original human tumor: 1, endothelial hyperplasia, vessel proliferation, 200× magnification; 2, cell and nuclear polymorphisms, 400× magnification; 3, endothelial hyperplasy, focal necrosis in the tumor, 200× magnification. AE staining. (C) PCR analysis of DNA isolated from the brain tissue carrying glioma graft and from the liver of the same animal (negative control). Human Alu-specific primers were used in amplification reaction. (D) Histofluorescence analysis of cryosections of mouse brains with human glioma graft. 1 and 2, overview of a tumor focus cross-section. Arrow indicates a demarcation line between the brain and the tumor. Zoom-in insets are shown in 3 and 4. Red signals correspond to graft cells that internalized TAMRA-Alu DNA. Bars correspond to 10 µm (1 and 2) and 50 µm (3–5); 6, 3D reconstruction of the tumor fragment. Red dots correspond to individual cells or clusters of cells.
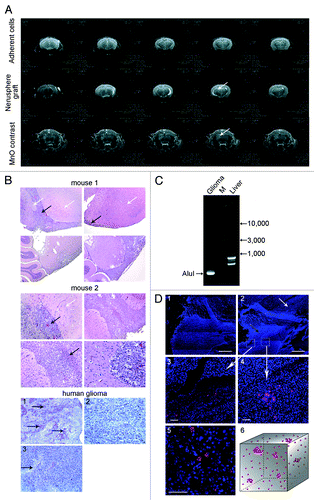
Figure 4. Pathomorphology, histofluorescence and PCR analysis of glioblastoma xenotransplants from brains of NOD/SCID mice. (A) Brain MRI of experimental animals. Upper panel: Serial mouse brain MRI sections on day 28 after glioma adherent cell fraction engraftment. Middle panel: Serial mouse brain MRI sections on day 28 after glioma neurosphere cell injection. Lower panel: Serial mouse brain manganese-enhanced MRI sections (same animal as above). Arrows indicate localization of the growing transplant. (B) Histology analysis of paraffin sections of glioma transplants and original glioblastoma biopsy. Black arrows on mouse brain sections indicate graft cells, and white arrows show normal brain tissue (mouse 1). Tumor displays surface localization and proliferation in interlobar gyri (central sulcus in this case). HE staining, 200× magnification. Mouse 2: large tumor lining the brain ventricle wall. Central part of the tumor is infiltrated with inflammatory cells (mostly granulocytes). Black arrows point to the cell infiltrate; white arrows show normal brain tissue. HE staining, 400× magnification. Original human tumor: 1, endothelial hyperplasia, vessel proliferation, 200× magnification; 2, cell and nuclear polymorphisms, 400× magnification; 3, endothelial hyperplasy, focal necrosis in the tumor, 200× magnification. AE staining. (C) PCR analysis of DNA isolated from the brain tissue carrying glioma graft and from the liver of the same animal (negative control). Human Alu-specific primers were used in amplification reaction. (D) Histofluorescence analysis of cryosections of mouse brains with human glioma graft. 1 and 2, overview of a tumor focus cross-section. Arrow indicates a demarcation line between the brain and the tumor. Zoom-in insets are shown in 3 and 4. Red signals correspond to graft cells that internalized TAMRA-Alu DNA. Bars correspond to 10 µm (1 and 2) and 50 µm (3–5); 6, 3D reconstruction of the tumor fragment. Red dots correspond to individual cells or clusters of cells.

Figure 5. Analysis of CP or CP+DNA treatments on tumorigenic efficiency of Krebs-2 tumor cells. (A and B) In vivo analysis. Groups of mice were i/m grafted with ascites cells collected from mice treated with CP or CP+DNA (different regimens). Plots show dynamics of tumor formation and transplant growth. In a group of CP+DNA (1–12 h), Krebs-2 transplant failed to proliferate in any of the animals. (C) Comparison of tumor graft growth in mice treated with CP or CP+DNA (18–30 h). CP+DNA (18–30 h) treatment schedule displays pronounced positive effect on transplant proliferation.
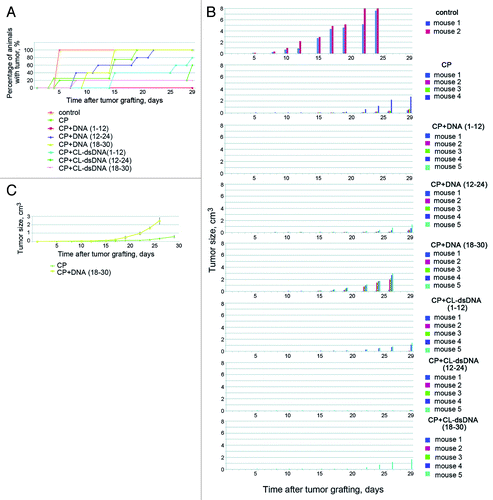
Figure 5. Analysis of CP or CP+DNA treatments on tumorigenic efficiency of Krebs-2 tumor cells. (A and B) In vivo analysis. Groups of mice were i/m grafted with ascites cells collected from mice treated with CP or CP+DNA (different regimens). Plots show dynamics of tumor formation and transplant growth. In a group of CP+DNA (1–12 h), Krebs-2 transplant failed to proliferate in any of the animals. (C) Comparison of tumor graft growth in mice treated with CP or CP+DNA (18–30 h). CP+DNA (18–30 h) treatment schedule displays pronounced positive effect on transplant proliferation.

Figure 6. Analysis of DSB formation and repair in ascites cells of Krebs-2 tumor; CP treatment was used to induce DSBs in experimental animals. (A) Results of three independent experiments (1, 2, and 3) to quantify γН2AХ-positive repair foci found at DSBs. FACS-based (1 and 2) and fluorescence microscopy-based (3) quantifications were performed. 4, schematic diagram comparing formation and repair dynamics of DSBs in bone marrow cells (red)Citation15 and in ascites cells Krebs-2 (blue). (B) Representative image of ascites Krebs-2 cells immunostained with γН2AХ-specific antibodies (1). 2, control, incubation with primary antibodies was omitted from the protocol. DAPI, chromatin staining; FITC, γН2AХ. Bars correspond to 10 µm. (C) Comet assay showing formation and disappearance of DSBs in ascites cells Krebs-2. Note the presence and absence of comet tails matches the timepoints with maximal and minimal DSBs shown on plot 4. Bars correspond to 50 µm.
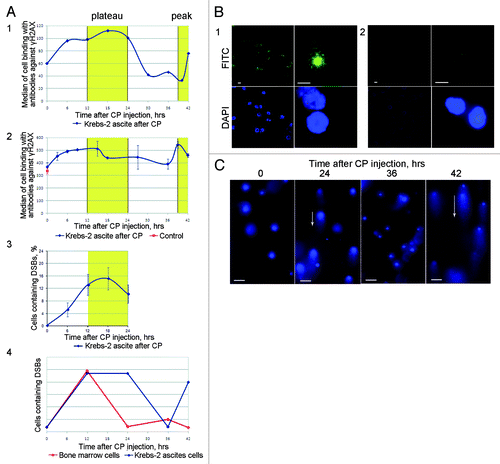
Figure 6. Analysis of DSB formation and repair in ascites cells of Krebs-2 tumor; CP treatment was used to induce DSBs in experimental animals. (A) Results of three independent experiments (1, 2, and 3) to quantify γН2AХ-positive repair foci found at DSBs. FACS-based (1 and 2) and fluorescence microscopy-based (3) quantifications were performed. 4, schematic diagram comparing formation and repair dynamics of DSBs in bone marrow cells (red)Citation15 and in ascites cells Krebs-2 (blue). (B) Representative image of ascites Krebs-2 cells immunostained with γН2AХ-specific antibodies (1). 2, control, incubation with primary antibodies was omitted from the protocol. DAPI, chromatin staining; FITC, γН2AХ. Bars correspond to 10 µm. (C) Comet assay showing formation and disappearance of DSBs in ascites cells Krebs-2. Note the presence and absence of comet tails matches the timepoints with maximal and minimal DSBs shown on plot 4. Bars correspond to 50 µm.

Figure 7. Cytofluorescence and flow cytometry analyses of TAMRA-Alu DNA internalization by various cellular communities. Field view is shown for microscopy imaging. DNA is stained with DAPI, FITC denotes CD34+ staining, and TAMRA corresponds to TAMRA-Alu DNA. (A) FACS profiles showing localization of TAMRA-labeled DNA in mouse lung tumor ascites. (B) FACS profiles showing localization of TAMRA-labeled DNA in mouse hepatoma ascites. (C) Internalization of TAMRA-labeled DNA by CD34+ human mesenchymal stem cells (short-term culture). (D) 3D reconstitution image of TAMRA-DNA internalization by human mesenchymal stem cells showing cytoplasmic localization of the probe. (E) FACS profiles showing localization of TAMRA-labeled DNA in CD34+ human bone marrow cells (short-term culture). (F) Cytofluorescence analysis of human bone marrow stem cells showing TAMRA-DNA labeling in CD34+ cells. (G and H) Non-tumorigenic human HEP-G2 cells grown in immunocompromised mice display no TAMRA-DNA signal in cellular compartments on either FACS profiles (G) or upon cytofluorescence analysis (H).
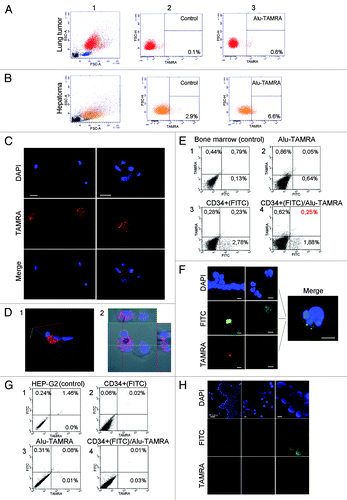
Figure 7. Cytofluorescence and flow cytometry analyses of TAMRA-Alu DNA internalization by various cellular communities. Field view is shown for microscopy imaging. DNA is stained with DAPI, FITC denotes CD34+ staining, and TAMRA corresponds to TAMRA-Alu DNA. (A) FACS profiles showing localization of TAMRA-labeled DNA in mouse lung tumor ascites. (B) FACS profiles showing localization of TAMRA-labeled DNA in mouse hepatoma ascites. (C) Internalization of TAMRA-labeled DNA by CD34+ human mesenchymal stem cells (short-term culture). (D) 3D reconstitution image of TAMRA-DNA internalization by human mesenchymal stem cells showing cytoplasmic localization of the probe. (E) FACS profiles showing localization of TAMRA-labeled DNA in CD34+ human bone marrow cells (short-term culture). (F) Cytofluorescence analysis of human bone marrow stem cells showing TAMRA-DNA labeling in CD34+ cells. (G and H) Non-tumorigenic human HEP-G2 cells grown in immunocompromised mice display no TAMRA-DNA signal in cellular compartments on either FACS profiles (G) or upon cytofluorescence analysis (H).
Supplemental material

Additional material

Download Zip (416.8 KB)