1,073
Views
30
CrossRef citations to date
0
Altmetric
Research Paper

Targeting HER3 with miR-450b-3p suppresses breast cancer cells proliferation

, , , , &
Pages 1404-1412 | Received 13 Mar 2014, Accepted 13 Jul 2014, Published online: 21 Jul 2014

Figures & data

Figure 1. The expressions of miR-450b-3p and HER3 in breast cancer cells. (A) Schematic representation of the interaction between miR-450b-3p and the binding site on the wild-type HER3 3′ UTR, and the 6 bp modified in the mutated control. (B) The abundance of miR-450b-3p of the seven types of tissue or cell lines was evaluated by real-time PCR. The 18S rRNA was used as control. After normalization, data were transformed as log10 of relative quantity (RQ). (C) The expression of HER3, HER2, and GAPDH (the loading control) were quantified by western blot in indicated cell lines. (D) MDA-MB-453 and SKBR3 were transfected with 1nmol miR-450b-3p precursor or scrambled oligonucleotides for 36 h, and then cells were harvested and analyzed by western blot. The results are representative of three independent experiments; bars, SD, * and #, significantly different compared with scrambled control (P < 0.05).
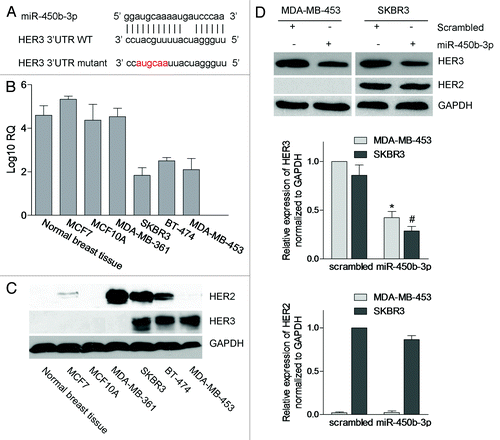
Figure 1. The expressions of miR-450b-3p and HER3 in breast cancer cells. (A) Schematic representation of the interaction between miR-450b-3p and the binding site on the wild-type HER3 3′ UTR, and the 6 bp modified in the mutated control. (B) The abundance of miR-450b-3p of the seven types of tissue or cell lines was evaluated by real-time PCR. The 18S rRNA was used as control. After normalization, data were transformed as log10 of relative quantity (RQ). (C) The expression of HER3, HER2, and GAPDH (the loading control) were quantified by western blot in indicated cell lines. (D) MDA-MB-453 and SKBR3 were transfected with 1nmol miR-450b-3p precursor or scrambled oligonucleotides for 36 h, and then cells were harvested and analyzed by western blot. The results are representative of three independent experiments; bars, SD, * and #, significantly different compared with scrambled control (P < 0.05).

Figure 2. miR-450b-3p directly targets 3′ UTR of HER3 and its downstream pathways. (A) Structures of the plasmid pGL3-promoter-HER3-3′ UTR. The whole HER3 3′ UTR (wild type or mutant) was fused to the immediate downstream of firefly luciferase cDNA in pGL3-promoter (Promega) to yield pGL3-promoter-HER3-3′ UTR wild type or mutant. (B) The luciferase activity of pGL3-promoter-HER3-3′ UTR wild type or mutant was measured in presence of scrambled miRNA or miR-450b-3p precursor. The renilla luciferase activity was used as the transfection control. The data was calculated from three independent experiments. Bars, SD. *, significantly different compared with scrambled control (P < 0.05). (C) The SKBR3 cells were transfected with pSUPER or increasing amount of pSUPER-miR-450b-3p for 36 h, and indicated molecules were analyzed by western blot. The results are representative of three independent experiments. Bars, SD. *, # and §, significantly different compared with scrambled control (P < 0.05).
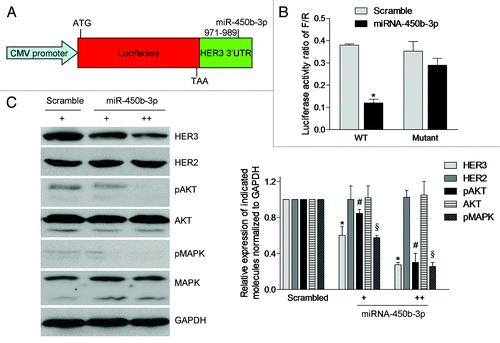
Figure 2. miR-450b-3p directly targets 3′ UTR of HER3 and its downstream pathways. (A) Structures of the plasmid pGL3-promoter-HER3-3′ UTR. The whole HER3 3′ UTR (wild type or mutant) was fused to the immediate downstream of firefly luciferase cDNA in pGL3-promoter (Promega) to yield pGL3-promoter-HER3-3′ UTR wild type or mutant. (B) The luciferase activity of pGL3-promoter-HER3-3′ UTR wild type or mutant was measured in presence of scrambled miRNA or miR-450b-3p precursor. The renilla luciferase activity was used as the transfection control. The data was calculated from three independent experiments. Bars, SD. *, significantly different compared with scrambled control (P < 0.05). (C) The SKBR3 cells were transfected with pSUPER or increasing amount of pSUPER-miR-450b-3p for 36 h, and indicated molecules were analyzed by western blot. The results are representative of three independent experiments. Bars, SD. *, # and §, significantly different compared with scrambled control (P < 0.05).

Figure 3. The effects of miR-450b-3p on the proliferation of cancer cells. (A) miR-450b-3p expression of the SKBR3 cells stably transfected with pSUPER-miR-450b-3p was evaluated by real-time PCR. (B) The HER3/AKT associated pathway was assessed by western blot in stable transfected cells and control cells. (C) Clonogenic assay was used to evaluate the proliferative activity of the cells. Two hundred indicated cells were seeded in medium including 20% FBS and grew for 15 d, and then stained by crystal violet and visualized. The photographs are representative of three independent experiments; bars, SD. * and #, significantly different compared with untransfected control (P < 0.05). (D) Subcutaneous xenografts formation was used to evaluate the tumorigenesis potential of SKBR3 cells transfected with indicated plasmid. The results are representative typical photographs of SKBR3 xenograft models. (E) Mice bearing SKBR3 xenografts were measured 28 d after inoculation once every 2 d. After 14 d, the mice were sacrificed and the tumors were removed and analyzed. * and #, significantly different compared with untransfected control (P < 0.05)
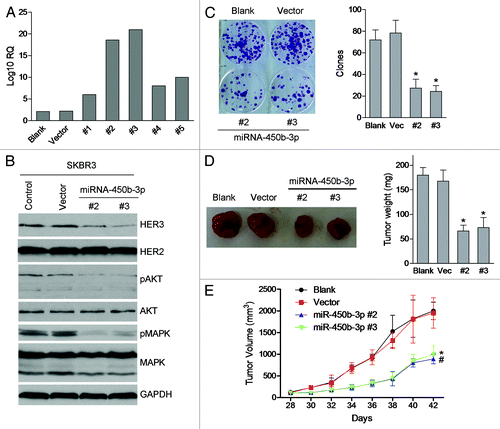
Figure 3. The effects of miR-450b-3p on the proliferation of cancer cells. (A) miR-450b-3p expression of the SKBR3 cells stably transfected with pSUPER-miR-450b-3p was evaluated by real-time PCR. (B) The HER3/AKT associated pathway was assessed by western blot in stable transfected cells and control cells. (C) Clonogenic assay was used to evaluate the proliferative activity of the cells. Two hundred indicated cells were seeded in medium including 20% FBS and grew for 15 d, and then stained by crystal violet and visualized. The photographs are representative of three independent experiments; bars, SD. * and #, significantly different compared with untransfected control (P < 0.05). (D) Subcutaneous xenografts formation was used to evaluate the tumorigenesis potential of SKBR3 cells transfected with indicated plasmid. The results are representative typical photographs of SKBR3 xenograft models. (E) Mice bearing SKBR3 xenografts were measured 28 d after inoculation once every 2 d. After 14 d, the mice were sacrificed and the tumors were removed and analyzed. * and #, significantly different compared with untransfected control (P < 0.05)

Figure 4. miR-450b-3p overexpression sensitizes the responsiveness to trastusumab and doxorubicin. Different clones of SKBR3 cells with stably transfected miR-450b-3p or control cells were treated with indicated concentration of trastusumab for 24 h (A) or with 0.5 μM of doxorubicin for 24 h (B) respectively. And then the cells were harvested and evaluated for the percentage of apoptosis by Annexin/propidium iodied assay.
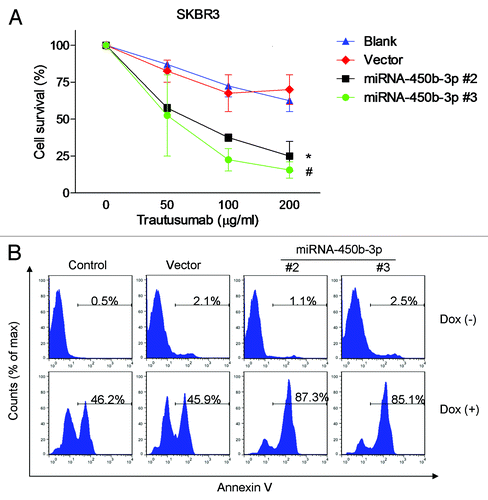
Figure 4. miR-450b-3p overexpression sensitizes the responsiveness to trastusumab and doxorubicin. Different clones of SKBR3 cells with stably transfected miR-450b-3p or control cells were treated with indicated concentration of trastusumab for 24 h (A) or with 0.5 μM of doxorubicin for 24 h (B) respectively. And then the cells were harvested and evaluated for the percentage of apoptosis by Annexin/propidium iodied assay.

Figure 5. The clinical significance of miR-450b-3p and HER3 expression. (A) The miR-450b-3p and HER3 expression in the tumor from 50 breast cancer patients was detected using q-PCR. HER3 expression was normalized to GAPDH. miR-450b-3p expression was normalized to 18S RNA. Data were transformed as log2 of relative quantity (RQ). (B) The miR-450b-3p in the tumor and paired adjacent non-tumorous tissues from 50 breast cancer patients was detected using q-PCR. The results were normalized to 18S RNA. Data were transformed as log10 of relative quantity. *, significantly different compared with adjacent non-tumorous tissues. (C) Kaplan–Meier curve was used to evaluate survival rate difference in the patients with or without more than 2-fold upregulated HER3 and 2-fold downregulated miR-450b-3p expression.
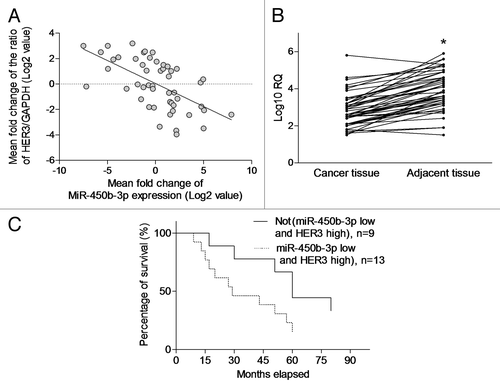
Figure 5. The clinical significance of miR-450b-3p and HER3 expression. (A) The miR-450b-3p and HER3 expression in the tumor from 50 breast cancer patients was detected using q-PCR. HER3 expression was normalized to GAPDH. miR-450b-3p expression was normalized to 18S RNA. Data were transformed as log2 of relative quantity (RQ). (B) The miR-450b-3p in the tumor and paired adjacent non-tumorous tissues from 50 breast cancer patients was detected using q-PCR. The results were normalized to 18S RNA. Data were transformed as log10 of relative quantity. *, significantly different compared with adjacent non-tumorous tissues. (C) Kaplan–Meier curve was used to evaluate survival rate difference in the patients with or without more than 2-fold upregulated HER3 and 2-fold downregulated miR-450b-3p expression.
Supplemental material

Additional material

Download Zip (373.8 KB)

Reprints and Corporate Permissions

Please note: Selecting permissions does not provide access to the full text of the article, please see our help page How do I view content?

To request a reprint or corporate permissions for this article, please click on the relevant link below:

Academic Permissions

Please note: Selecting permissions does not provide access to the full text of the article, please see our help page How do I view content?

Obtain permissions instantly via Rightslink by clicking on the button below:

If you are unable to obtain permissions via Rightslink, please complete and submit this Permissions form. For more information, please visit our Permissions help page.