Figures & data
Figure 1 Validation of the proteomic data for PAI-1 and PAI-2. To confirm the relative changes in PAI-1 and PAI-2 protein expression observed in the proteomic analysis, wild-type and Cav-1 KO MSFs were subjected to immunoblot and immunofluorescence analyses with antibodies directed against PAI-1 and PAI-2. (A) Western blotting for PAI-1. Note that PAI-1 expression is upregulated in Cav-1 KO MSFs. Immunoblotting with β-tubulin is shown as a control for equal loading. (B) Intracellular localization of PAI-1. Note that PAI-1 expression is increased in Cav-1 KO MSFs. Nuclei were immunostained with Hoechst (blue). Images captured at original magnification of 63x. (C) Localization of PAI-1 in fibroblast-derived extracellular matrices. Wild-type and Cav-1 KO MSFs were plated onto gelatin cross-linked coverslips. Fresh medium containing ascorbic acid was added every other day for 5 d to induce production of extracellular matrix. Unextracted matrices were then fixed and immunostained with antibodies against PAI-1. Note that PAI-1 is elevated in Cav-1 KO MSF-derived extracellular matrices, indicating an increased secretion of PAI-1 by Cav-1 KO MSFs. Nuclei were immunostained with Hoechst (blue). Images were captured at original magnification 63x. (D) Immunoblotting for PAI-2. Note that PAI-2 expression is upregulated in Cav-1 KO MSFs. Immunoblotting with β-tubulin is shown as a control for equal loading.
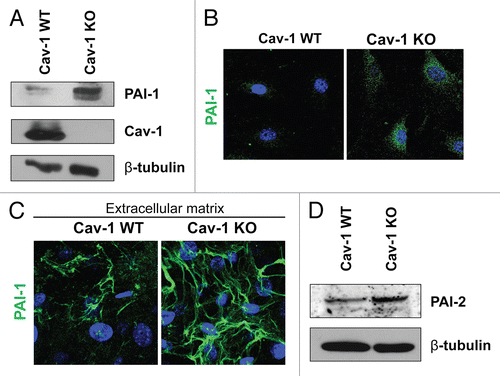
Figure 2 Expression of PAI-1 and PAI-2 is elevated in Cav-1-deficient fibroblasts of human breast cancer tissues. Paraffin-embedded sections of human breast cancer tissues lacking stromal Cav-1 were immunostained with antibodies directed against PAI-1 (A and B) and PAI-2 (C and D). Slides were counterstained with hematoxylin. Note that PAI-1 stained positive in both stromal and cancer cells, whereas PAI-2 expression is observed only in stromal cells. White arrows indicate Cav-1-deficient fibroblasts that stained positive for both PAI-1 and PAI-2. Images were captured at an original magnification of 20x and 40x. s, stromal cells; c, cancer cells.
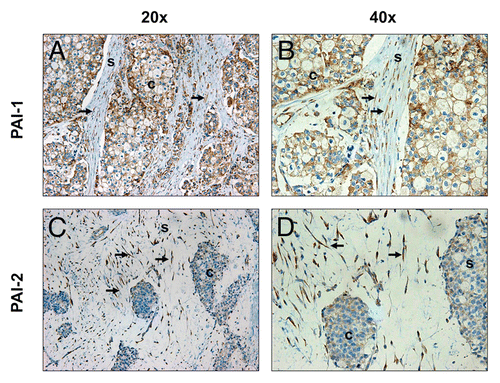
Figure 3 Recombinant overexpression of PAI-1 or PAI-2 does not alter Cav-1 expression levels. To assess the regulation of Cav-1 by PAI-1 and PAI-2 in fibroblasts, we stably overexpressed PAI-1 or PAI-2 in immortalized human fibroblasts (hTERT-BJ1) using lentiviral vectors. As a control (Ctrl), hTERT-BJ1 fibroblasts were transduced with an empty vector. The overexpression of PAI-1 and PAI-2 was confirmed by western blot (A and B), respectively. Immunoblotting with β-tubulin is shown as a control for equal loading. (C) The expression of Cav-1 in fibroblasts overexpressing PAI-1 or PAI-2 was assessed by western blotting. Note that no differences in Cav-1 levels were observed. Immunoblottings for PAI-1 and PAI-2 are also displayed. Immunoblotting for β-tubulin is shown as a control for equal loading.
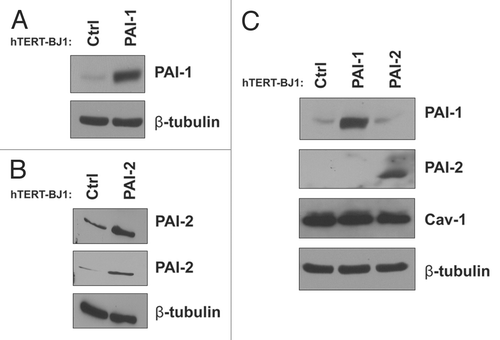
Figure 4 Overexpression of PAI-1 or PAI-2 leads to the upregulation of myofibroblastic markers. To evaluate whether the overexpression of PAI-1 and PAI-2 phenocopy the myofibroblastic phenotype of Cav-1-deficient fibroblasts, the expression of several myofibroblastic markers was assessed in fibroblast control or overexpressing PAI-1 or PAI-2. (A) Localization of calponin (upper parts) and vimentin (lower parts). Note that overexpression of PAI-1 or PAI-2 upregulates the levels of two myofibroblastic markers, calponin and vimentin. Nuclei were immunostained with Hoechst (blue). Images captured at original magnification of 63x. (B) Immunoblotting for vimentin and fibronectin. Note that overexpression of PAI-1 or PAI-2 upregulates vimentin and the overexpression of PAI-1 increases the expression of fibronectin. Immunoblotting with β-tubulin is shown as a control for equal loading. (C) Localization of fibronectin in fibroblast-derived extracellular matrices. Fibroblasts overexpressing PAI-1 or PAI-2 along with controls were plated onto gelatin cross-linked coverslips. Fresh medium containing ascorbic acid was added every other day for 5 d to induce extracellular matrix production. Then, the cells with their matrices were fixed and immunostained with an antibody against fibronectin. Note that PAI-1 overexpression increases fibronectin deposition, a myofibroblastic marker. Nuclei were counterstained with Hoechst (blue). Images captured at original magnification of 63x. Ctrl, fibroblasts containing empty vector alone; PAI-1, fibroblasts overexpressing PAI-1; PAI-2, fibroblasts overexpressing PAI-2.
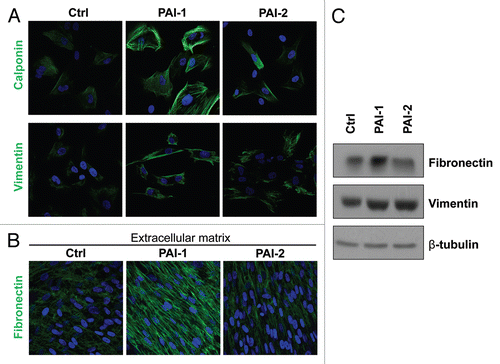
Figure 5 Fibroblasts overexpressing PAI-1 or PAI-2 promote tumor growth in vitro. Fibroblasts (control vs. those overexpressing PAI-1 or PAI-2) were co-cultured with MDA-MB-231 GFP+ (MDA) cells in a 5:1 ratio. The fluorescence was determined (as a measurement of MDA growth) every other day for 8 d and normalized to the fluorescence intensity of the first day to avoid differences due to cell attachment. Note a significant increase in MDA growth in the presence of fibroblasts overexpressing PAI-1 or PAI-2 compared with controls, after the fourth day of co-culture. Results are represented as mean ± SEM. n.s., not significant. An asterisk indicates that p ≤ 0.05. Ctrl, fibroblasts containing empty vector alone; PAI-1, fibroblasts overexpressing PAI-1; PAI-2, fibroblasts overexpressing PAI-2; MDA, MDA-MB-231 (GFP+).
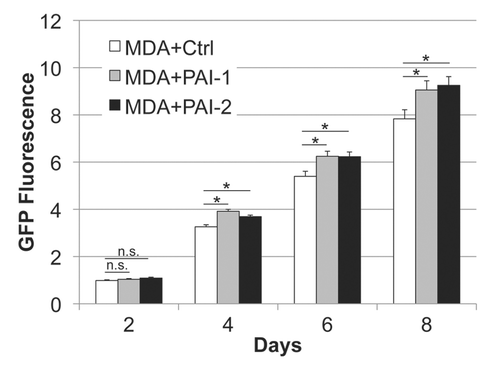
Figure 6 Fibroblasts overexpressing PAI-1 or PAI-2 promote tumor growth in vivo. To determine whether overexpression of PAI-1 or PAI-2 can phenocopy the tumor-promoting effects of Cav-1-deficient fibroblasts, fibroblasts (control vs. those overexpressing PAI-1 or PAI-2) were co-injected with a human breast cancer cell line [MDA-MB-231 (GFP+) cells] (MDA) in the flanks of nude mice. After 3 weeks, the tumors that formed were harvested and subjected to a detailed analysis. Note that relative to controls, PAI-1 or PAI-2 expressing fibroblasts increased tumor mass by ∼3-to-4-fold (A) and tumor volume by ∼4-fold. (B) Results are represented as the mean ± SEM. An asterisk indicates that p ≤ 0.05 compared with controls. n = 10 flank injections for each experimental group. Ctrl, fibroblasts containing empty vector alone; PAI-1, fibroblasts overexpressing PAI-1; PAI-2, fibroblasts overexpressing PAI-2; MDA, MDA-MB-231 (GFP+).
![Figure 6 Fibroblasts overexpressing PAI-1 or PAI-2 promote tumor growth in vivo. To determine whether overexpression of PAI-1 or PAI-2 can phenocopy the tumor-promoting effects of Cav-1-deficient fibroblasts, fibroblasts (control vs. those overexpressing PAI-1 or PAI-2) were co-injected with a human breast cancer cell line [MDA-MB-231 (GFP+) cells] (MDA) in the flanks of nude mice. After 3 weeks, the tumors that formed were harvested and subjected to a detailed analysis. Note that relative to controls, PAI-1 or PAI-2 expressing fibroblasts increased tumor mass by ∼3-to-4-fold (A) and tumor volume by ∼4-fold. (B) Results are represented as the mean ± SEM. An asterisk indicates that p ≤ 0.05 compared with controls. n = 10 flank injections for each experimental group. Ctrl, fibroblasts containing empty vector alone; PAI-1, fibroblasts overexpressing PAI-1; PAI-2, fibroblasts overexpressing PAI-2; MDA, MDA-MB-231 (GFP+).](/cms/asset/5f07bc7f-c886-46d0-90d4-3790033beeae/kccy_a_10916002_f0006.gif)
Figure 7 Fibroblasts overexpressing PAI-1 or PAI-2 do not affect tumor angiogenesis. Paraffin-embedded tumor sections from MDA-MB-231 cells (grown the presence of control fibroblasts or fibroblasts overexpressing PAI-1 or PAI-2) were immunostained with anti-CD31 antibodies and vessel density was determined. (A) Representative images for CD-31 immuno-staining are shown. Slides were counterstained with hematoxylin. Images were captured at 20x. (B) Quantification of the CD-31-positive vessels. Note that no significant differences in vessel density were observed. Results are represented as the mean ± SEM; n.s., not significant. (C) Immunhistochemical analysis of fibronectin. Note that MDA-MB-231 cells grown in the presence of fibroblasts overexpressing PAI-1 exhibit increased deposition of fibronectin in the stromal compartment. Images were captured at 20x. Ctrl, fibroblasts containing empty vector alone; PAI-1, fibroblasts overexpressing PAI-1; PAI-2, fibroblasts overexpressing PAI-2; MDA, MDA-MB-231 (GFP+).
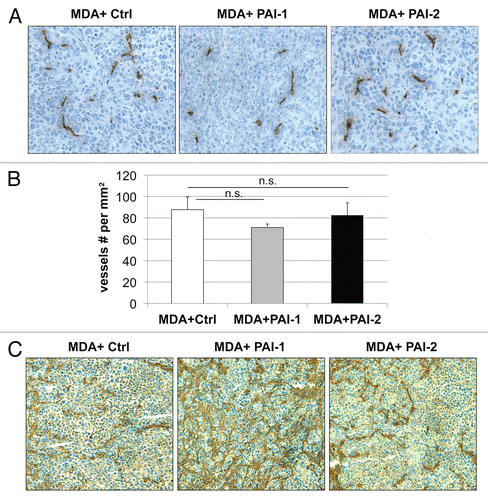
Figure 8 Recombinant expression of PAI-1 or PAI-2 increases autophagy in fibroblasts. To assess the effects of PAI-1 and PAI-2 overexpression on autophagy in fibroblasts, the levels of a variety of autophagic markers were assessed in control fibroblasts and in PAI-1/2(+)-overexpressing fibroblasts. (A) Determination of AVOs (acidic vesicular organelles) using acridine orange. In orange-acridine stained cells, cytoplasm fluorescences green, whereas acid compartments fluorescence red. Note that fibroblasts overexpressing PAI-1 or PAI-2 display a larger amount of AVOs compared with control fibroblasts. Images captured at original magnification of 63x. Nuclei were stained with Hoechst (blue). (B) Localization of Beclin-1. Note that overexpression of PAI-1 or PAI-2 upregulates the expression of Beclin-1, an autophagic marker. Images were captured at an original magnification of 63x. Nuclei were stained with Hoechst (blue). (C) Immunoblotting for LAMP-1 and LAMP-2. Note that the expression of autophagic markers, LAMP-1 and LAMP-2, is increased in fibroblasts overexpressing PAI-1 or PAI-2. Immunoblotting with β-tubulin is shown as a control for equal loading. (D) Proliferation of fibroblasts overexpressing PAI-1 or PAI-2. Note that BrdU incorporation is significantly reduced in fibroblasts overexpressing PAI-1 or PAI-2 as compared with control fibroblasts. Results are represented as the mean ± SEM. An asterisk indicates that p ≤ 0.05, compared with controls. Ctrl, fibroblasts containing empty vector alone; PAI-1, fibroblasts overexpressing PAI-1; PAI-2, fibroblasts overexpressing PAI-2.
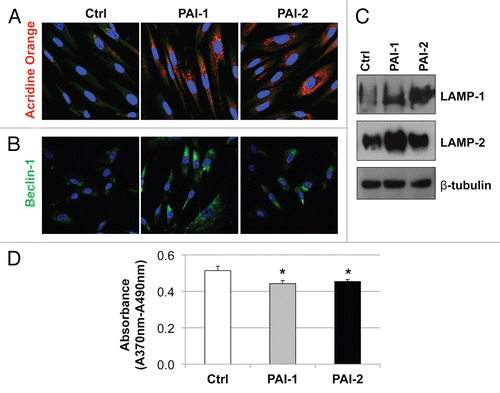
Figure 9 Fibroblasts overexpressing PAI-1 or PAI-2 increase the mitochondrial mass of adjacent breast cancer cells. Co-cultures of MDA-MB-231 cells and fibroblasts (control vs. those overexpressing PAI-1 or PAI-2) were immunostained with antibodies against a mitochondrial membrane antigen (red). Note that the mitochondrial mass is higher in MDA-MB-231 cells in co-culture with PAI-1/2(+) fibroblasts as compared with control fibroblasts. Hoechst was used to stain nuclei (blue). Images captured at an original magnification of 63x. Ctrl, fibroblasts containing empty vector alone; PAI-1, fibroblasts overexpressing PAI-1; PAI-2, fibroblasts overexpressing PAI-2.
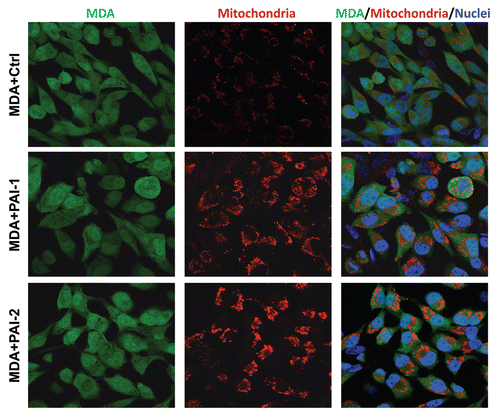
Figure 10 Overexpression of PAI-1 or PAI-2 in stromal fibroblasts reduces tumor apoptosis. Tunnel assays were performed on MDA-MB-231 tumors grown in the presence of fibroblasts (control vs. those overexpressing PAI-1 or PAI-2) and the numbers of apoptotic cells were quantitated. (A) Representative images of tunnel assay staining are shown. Images were captured at an original magnification of 40x. Slides were counterstained with hematoxylin. (B) Quantification of apoptotic tumor cell number. Note that apoptosis in MDA-MB-231 was significantly reduced when grown in presence of PAI-1- or PAI-2-overexpresing fibroblasts as compared with control fibroblasts. Results are represented as the mean ± SEM. An asterisk indicates that p ≤ 0.05 and two asterisks indicate that p ≤ 0.001. Ctrl, fibroblasts containing empty vector alone; PAI-1, fibroblasts overexpressing PAI-1; PAI-2, fibroblasts overexpressing PAI-2; MDA, MDA-MB-231 (GFP+).
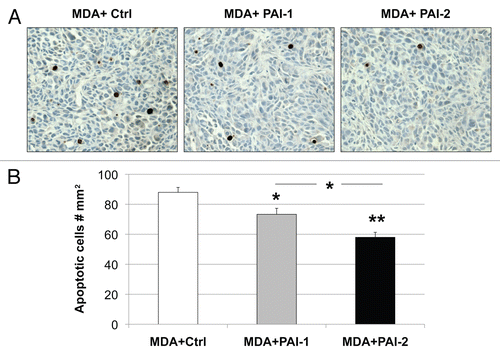
Figure 11 Fibroblasts overexpressing PAI-1 or PAI-2 do not affect the proliferation of tumor cells in vivo. (A) Quantification of mitotic tumor cells in MDA-MB-231 tumors grown in presence of control fibroblasts (Ctrl) or those overexpressing PAI-1 or PAI-2. Note that no significant differences were observed among these three groups. (B) Ratio of mitotic cells/apoptotic cells in epithelial tumor cells in MDA tumors grown in presence of fibroblasts. Note that the mitosis/apoptosis ratios are significantly higher for MDA tumors grown in the in presence of fibroblasts overexpressing PAI-1 or PAI-2 as compared with control fibroblasts. n.s.: not significant. Results are represented as the mean ± SEM. An asterisk indicates that p ≤ 0.05 compared with controls. Ctrl, fibroblasts containing empty vector alone; PAI-1, fibroblasts overexpressing PAI-1; PAI-2, fibroblasts overexpressing PAI-2; MDA, MDAMB-231 (GFP+).
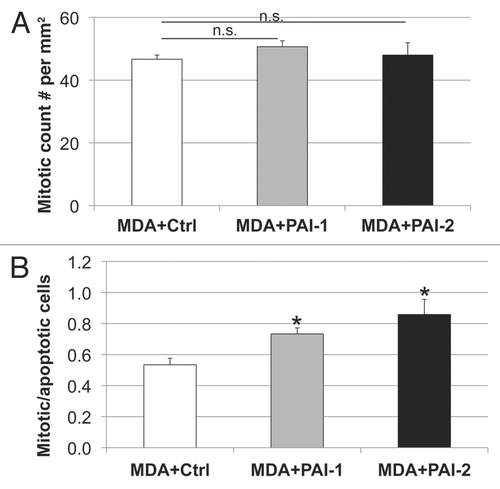
Figure 12 Fibroblasts overexpressing PAI-1 or PAI-2 increase lung metastasis. MDA-MB-231 cells were co-injected with fibroblasts in the tail vein of nude mice. After 7 weeks, the lungs were insufflated with India ink dye and the number of metastases was counted. (A) Representative images of lung metastasis for each group are shown. (B) Quantification of lung metastasis. Note that fibroblasts overexpressing PAI-1 or PAI-2 significantly increased the number of MDA-MB-231 lung metastases (∼3.8 and 5.3 fold, respectively) as compared with controls. An asterisk indicates that p ≤ 0.05. Ctrl, fibroblasts containing empty vector alone; PAI-1, fibroblasts overexpressing PAI-1; PAI-2, fibroblasts overexpressing PAI-2; MDA, MDA-MB-231 (GFP+).
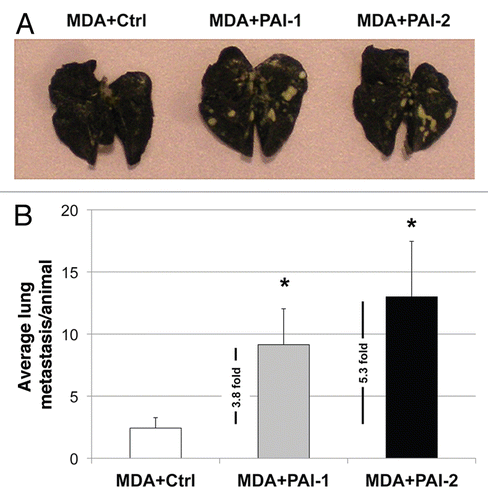
Table 1 Proteomic analysis of upregulated proteins in cell lysates from Cav-1-/- null MSFs
Table 2 Proteomic analysis of proteins in the conditioned media from Cav-1-/- MSFs