880
Views
26
CrossRef citations to date
0
Altmetric
Extra Views

FoxM1 knockdown sensitizes human cancer cells to proteasome inhibitor-induced apoptosis but not to autophagy

&
Pages 3269-3273 | Received 09 Aug 2011, Accepted 12 Aug 2011, Published online: 01 Oct 2011

Figures & data

Figure 1 PIs sensitized the human cancer cells to apoptotic cell death following knockdown of FoxM1. MIA PaCa-2 vector control and short hairpin (sh) FoxM1 pancreatic human cancer cell lines were grown in DMEM medium (Invitrogen). MDA-MB-231 vector and shFoxM1 breast human cancer cell lines were grown in RPMI medium (Invitrogen). Stable cell lines were generated by transduction of control and FoxM1 shRNA lentiviral particles (Sigma) followed by selection with puromycin (Sigma). Actively dividing cells were seeded into a 100 mm plate at a density of 7.5 × 10⁵ cells. Cells were treated with thiostrepton, MG132 and bortezomib for 24 h following which the cells were lysed. Cells were lysed in IP buffer (20 mM HEPES, 1% Triton X-100, 150 mM NaCl, 1 mM EDTA, 1 mM EGTA, 100 mM NaF, 10 mM Na4P2O7, 1 mM sodium orthovanadate, 0.2 mM PMSF supplemented with protease inhibitor tablet Roche Applied Sciences) and the protein concentration was determined using the Bio-Rad protein assay reagent. Fifty micrograms of the cell lysates were separated by electrophoresis on SDS-polyacrylamide mini gel and transferred to PVDF membrane. Immunoblotting was performed with specific antibodies for cleaved caspase-3 (9664 cell signaling) and β-actin (A5441, Sigma). (A) Control and shFoxM1-k/d MIA PaCa-2 pancreatic cancer cells. (B) MDA-MB-231 breast cancer cells. (C) HCT-116 colon cancer cells were treated with thiostrepton, MG132 and bortezomib as shown for 24 h, total cell lysates were extracted and immunoblotted with antibodies for cleaved caspase-3. β-actin was used as loading control.
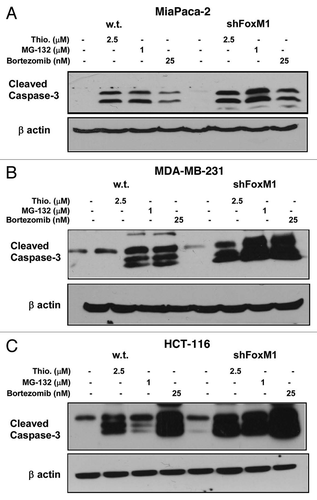
Figure 1 PIs sensitized the human cancer cells to apoptotic cell death following knockdown of FoxM1. MIA PaCa-2 vector control and short hairpin (sh) FoxM1 pancreatic human cancer cell lines were grown in DMEM medium (Invitrogen). MDA-MB-231 vector and shFoxM1 breast human cancer cell lines were grown in RPMI medium (Invitrogen). Stable cell lines were generated by transduction of control and FoxM1 shRNA lentiviral particles (Sigma) followed by selection with puromycin (Sigma). Actively dividing cells were seeded into a 100 mm plate at a density of 7.5 × 10⁵ cells. Cells were treated with thiostrepton, MG132 and bortezomib for 24 h following which the cells were lysed. Cells were lysed in IP buffer (20 mM HEPES, 1% Triton X-100, 150 mM NaCl, 1 mM EDTA, 1 mM EGTA, 100 mM NaF, 10 mM Na4P2O7, 1 mM sodium orthovanadate, 0.2 mM PMSF supplemented with protease inhibitor tablet Roche Applied Sciences) and the protein concentration was determined using the Bio-Rad protein assay reagent. Fifty micrograms of the cell lysates were separated by electrophoresis on SDS-polyacrylamide mini gel and transferred to PVDF membrane. Immunoblotting was performed with specific antibodies for cleaved caspase-3 (9664 cell signaling) and β-actin (A5441, Sigma). (A) Control and shFoxM1-k/d MIA PaCa-2 pancreatic cancer cells. (B) MDA-MB-231 breast cancer cells. (C) HCT-116 colon cancer cells were treated with thiostrepton, MG132 and bortezomib as shown for 24 h, total cell lysates were extracted and immunoblotted with antibodies for cleaved caspase-3. β-actin was used as loading control.

Figure 2 FoxM1 knockdown cells undergo stronger apoptosis induced by PIs. Densitometry was performed on scanned immunoblot images using the ImageJ gel analysis tool. The gel analysis tool was used to obtain the absolute intensity (AI) for each experimental cleaved caspase-3 band for control and shFoxM1-k/d pancreatic (A) MIA Paca-2, breast (B) MDA-MB-231 and colon (C) HCT-116 cancer cells. Relative intensity (RI) for each experimental band was calculated by normalizing the experimental AI to the corresponding loading control β-actin AI. Columns, mean of three separate experiments; bars, SD.
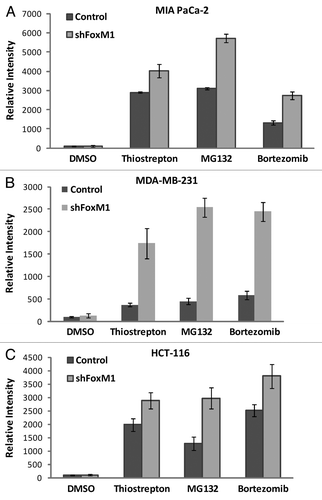
Figure 2 FoxM1 knockdown cells undergo stronger apoptosis induced by PIs. Densitometry was performed on scanned immunoblot images using the ImageJ gel analysis tool. The gel analysis tool was used to obtain the absolute intensity (AI) for each experimental cleaved caspase-3 band for control and shFoxM1-k/d pancreatic (A) MIA Paca-2, breast (B) MDA-MB-231 and colon (C) HCT-116 cancer cells. Relative intensity (RI) for each experimental band was calculated by normalizing the experimental AI to the corresponding loading control β-actin AI. Columns, mean of three separate experiments; bars, SD.

Figure 3 Knockdown of FoxM1 does not affect autophagy induced by PIs. Cells were stained using Enzo Cyto-ID (ENZ-51031-K200Enzo Life Sciences), according to the manufacturer's recommendations. Briefly 3–4 × 10⁵ cells were plated in 60 mm culture dishes and allowed to grow overnight. Cells were treated with thiostrepton, MG132 and bortezomib. Following overnight incubation of drugs, cells were stained with Cyto-ID autophagy detection dye and submitted for flow cytometry analysis. Control and shFoxM1-k/d (A) MIA PaCa-2 pancreatic, (B) MDA-MB-231 breast and (C). HCT-116 colon cancer cells were treated with PIs as shown for 24 h stained with Cyto-ID autophagy detection green fluorescent dye and analyzed by using FL-1 channel of flow cytometer with excitation wavelength of 488 nM. Columns demonstrate percentage of cells undergoing autophagy. (Columns, mean of three separate experiments; bars, SD).
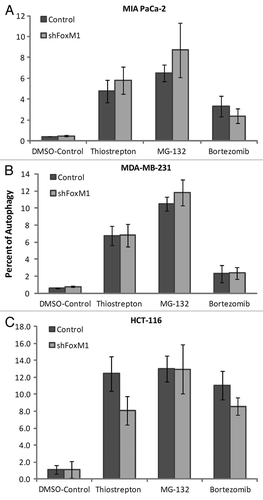
Figure 3 Knockdown of FoxM1 does not affect autophagy induced by PIs. Cells were stained using Enzo Cyto-ID (ENZ-51031-K200Enzo Life Sciences), according to the manufacturer's recommendations. Briefly 3–4 × 10⁵ cells were plated in 60 mm culture dishes and allowed to grow overnight. Cells were treated with thiostrepton, MG132 and bortezomib. Following overnight incubation of drugs, cells were stained with Cyto-ID autophagy detection dye and submitted for flow cytometry analysis. Control and shFoxM1-k/d (A) MIA PaCa-2 pancreatic, (B) MDA-MB-231 breast and (C). HCT-116 colon cancer cells were treated with PIs as shown for 24 h stained with Cyto-ID autophagy detection green fluorescent dye and analyzed by using FL-1 channel of flow cytometer with excitation wavelength of 488 nM. Columns demonstrate percentage of cells undergoing autophagy. (Columns, mean of three separate experiments; bars, SD).

Reprints and Corporate Permissions

Please note: Selecting permissions does not provide access to the full text of the article, please see our help page How do I view content?

To request a reprint or corporate permissions for this article, please click on the relevant link below:

Academic Permissions

Please note: Selecting permissions does not provide access to the full text of the article, please see our help page How do I view content?

Obtain permissions instantly via Rightslink by clicking on the button below:

If you are unable to obtain permissions via Rightslink, please complete and submit this Permissions form. For more information, please visit our Permissions help page.