1,001
Views
29
CrossRef citations to date
0
Altmetric
Report

Nuclear import of a lipid-modified transcription factor

Mobilization of NFAT5 isoform a by osmotic stress

, , , , , , , , & show all
Pages 3897-3911 | Received 19 Aug 2011, Accepted 09 Sep 2011, Published online: 15 Nov 2011

Figures & data

Figure 1 Protein isoforms, transcripts and expression of NFAT5. (A) Schematic alignment of NFAT5 isoforms a, b and c. The 3 main protein domains are two transactivation domains (TAD1/2) and a Rel homology domain (RHD). Tad1 contains a hypothetical auxiliary export domain (AED) followed by a nuclear localization sequence (NLS). The three isoforms differ in their N-terminal sequence. Only NFAT5a has the N-terminal glycine for myristoylation (purple). Possible cysteines for palmitoylation (green) are indicated.Supplemental Material A contains a Table of NFAT5 orthologs and their alignment. (B) Schematic representation of the mRNA architecture for all known NFAT5 transcripts. The respective protein isoforms are indicated next to the transcript number by their letter codes. (C) Endogenous NFAT5a mRNA expression in HeLa cells was tested with qPCR. All three mRNA segments targeted, namely, -|X (occurring in transcripts 1 and 4, see andSup. Material A for the aligment of the transcripts), exon 2|B (occurring in transcripts 1, 2 and 6) and exon 4|D (occurring in transcripts 1–4 and 6), were found to be present in the cells. The PCR products were analyzed on an agarose gel, and the bands were sequenced to confirm the identity of the respective mRNA segments.
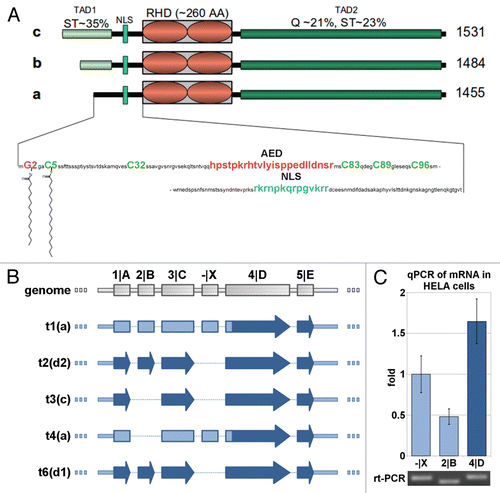
Figure 1 Protein isoforms, transcripts and expression of NFAT5. (A) Schematic alignment of NFAT5 isoforms a, b and c. The 3 main protein domains are two transactivation domains (TAD1/2) and a Rel homology domain (RHD). Tad1 contains a hypothetical auxiliary export domain (AED) followed by a nuclear localization sequence (NLS). The three isoforms differ in their N-terminal sequence. Only NFAT5a has the N-terminal glycine for myristoylation (purple). Possible cysteines for palmitoylation (green) are indicated.Supplemental Material A contains a Table of NFAT5 orthologs and their alignment. (B) Schematic representation of the mRNA architecture for all known NFAT5 transcripts. The respective protein isoforms are indicated next to the transcript number by their letter codes. (C) Endogenous NFAT5a mRNA expression in HeLa cells was tested with qPCR. All three mRNA segments targeted, namely, -|X (occurring in transcripts 1 and 4, seeTable 1 andSup. Material A for the aligment of the transcripts), exon 2|B (occurring in transcripts 1, 2 and 6) and exon 4|D (occurring in transcripts 1–4 and 6), were found to be present in the cells. The PCR products were analyzed on an agarose gel, and the bands were sequenced to confirm the identity of the respective mRNA segments.

Figure 2 Transcription factor NFAT5a is N-terminal myristoylated and palmitoylated. (A) In vitro transcription/translation (TNT) of NFAT5a(AA1–541)-GST (wt) and its G2A mutant was performed in the presence of3H-labeled myristate. Expression was monitored by protein gel blot detection.3H incorporation was measured with a TLC linear analyzer. The scan shows that only NFAT5a-GST with an intact glycine at position 2 incorporates the myristoyl anchor. (B) HeLa cells were transiently transfected with NFAT5a-HA (wt) and NFAT5a(G2A)-HA. Proteins were purified from cells after in vivo labeling with3H-myristate, detected by immunoblotting and scanned for3H incorporation. Although the western signal is significantly lower for wt NFAT5a-HA in comparison to the mutant, only wt gives rise to a radioactive signal. As a control, non-transfected cells were used, and no signal could be detected. (C) In vitro TNT of NFAT5a(AA1–123)-HA (wt) and its mutants C5A and G2A was performed in the presence of activated3H-palmitate-CoA. Incorporation of radioactive palmitate was monitored by TLC scanning. Immunoblotting was used to monitor protein expression. The western bands are comparable in strength. The TLC signal for the wt is about double the size of the C5A mutant's signal. There is no TLC signal for the G2A mutant. No plasmid was used for the control reaction. (D) HeLa cells were transiently transfected with NFAT5a-HA (wt) and its mutants C5A and G2A. After transfection, cells were subjected to in vivo labeling with3H-palmitate. Proteins were immunoprecipitated, quantified by immunoblotting and scanned for labeled palmitate attachment. Although the expression of the wt is significantly weaker than the mutant ones, the TLC signal strength is comparable. Non-transfected cells were used as a background control.
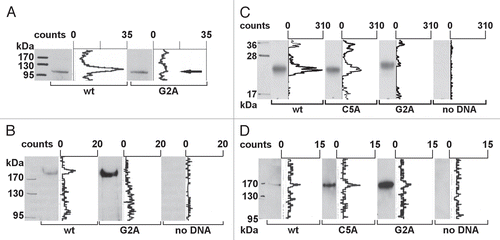
Figure 2 Transcription factor NFAT5a is N-terminal myristoylated and palmitoylated. (A) In vitro transcription/translation (TNT) of NFAT5a(AA1–541)-GST (wt) and its G2A mutant was performed in the presence of3H-labeled myristate. Expression was monitored by protein gel blot detection.3H incorporation was measured with a TLC linear analyzer. The scan shows that only NFAT5a-GST with an intact glycine at position 2 incorporates the myristoyl anchor. (B) HeLa cells were transiently transfected with NFAT5a-HA (wt) and NFAT5a(G2A)-HA. Proteins were purified from cells after in vivo labeling with3H-myristate, detected by immunoblotting and scanned for3H incorporation. Although the western signal is significantly lower for wt NFAT5a-HA in comparison to the mutant, only wt gives rise to a radioactive signal. As a control, non-transfected cells were used, and no signal could be detected. (C) In vitro TNT of NFAT5a(AA1–123)-HA (wt) and its mutants C5A and G2A was performed in the presence of activated3H-palmitate-CoA. Incorporation of radioactive palmitate was monitored by TLC scanning. Immunoblotting was used to monitor protein expression. The western bands are comparable in strength. The TLC signal for the wt is about double the size of the C5A mutant's signal. There is no TLC signal for the G2A mutant. No plasmid was used for the control reaction. (D) HeLa cells were transiently transfected with NFAT5a-HA (wt) and its mutants C5A and G2A. After transfection, cells were subjected to in vivo labeling with3H-palmitate. Proteins were immunoprecipitated, quantified by immunoblotting and scanned for labeled palmitate attachment. Although the expression of the wt is significantly weaker than the mutant ones, the TLC signal strength is comparable. Non-transfected cells were used as a background control.

Figure 3 Localization studies of NFAT5 isoforms and their mutants. HeLa cells were transfected with C-terminal GFP-tagged NFAT5 isoforms a, b and c and the mutants G2A and C5A (green). Squares indicate areas of interest. Full-size images are available athttp://mendel.bii.a-star.edu.sg/SEQUENCES/NFAT5_2011/. (A) The ER was stained with anti-PDI antibodies (red). NFAT5a and the C5A mutant co-localize with the ER. The isoforms b and c and the G2A mutant do not co-localize. (B) Golgi was stained with Giantin (red). NFAT5a and NFAT5a(C5A) co-localize with the Golgi. Isoforms b and c and the G2A mutant do not show a specific Golgi localization pattern. (C) The plasma membrane (PM) was stained with wheat germ agglutinin Alexa 555 (red). NFAT5a-GFP co-localizes with the PM. NFAT5b/c and the mutants G2A and C5A do not co-localize. (D) This part shows NFAT5a transfected cells treated with two inhibitors. With treatment of 2-Bromo palmitate, which inhibits palmitoylation, NFAT5a accumulates in the ER and the Golgi but not at the PM. Brefeldin A disrupts the Golgi. Localization to the ER can still be observed, but co-localization with the PM is inhibited (Scale bars 10 µm).

Figure 3 Localization studies of NFAT5 isoforms and their mutants. HeLa cells were transfected with C-terminal GFP-tagged NFAT5 isoforms a, b and c and the mutants G2A and C5A (green). Squares indicate areas of interest. Full-size images are available athttp://mendel.bii.a-star.edu.sg/SEQUENCES/NFAT5_2011/. (A) The ER was stained with anti-PDI antibodies (red). NFAT5a and the C5A mutant co-localize with the ER. The isoforms b and c and the G2A mutant do not co-localize. (B) Golgi was stained with Giantin (red). NFAT5a and NFAT5a(C5A) co-localize with the Golgi. Isoforms b and c and the G2A mutant do not show a specific Golgi localization pattern. (C) The plasma membrane (PM) was stained with wheat germ agglutinin Alexa 555 (red). NFAT5a-GFP co-localizes with the PM. NFAT5b/c and the mutants G2A and C5A do not co-localize. (D) This part shows NFAT5a transfected cells treated with two inhibitors. With treatment of 2-Bromo palmitate, which inhibits palmitoylation, NFAT5a accumulates in the ER and the Golgi but not at the PM. Brefeldin A disrupts the Golgi. Localization to the ER can still be observed, but co-localization with the PM is inhibited (Scale bars 10 µm).

Figure 5 Localization studies of NFAT5a under isotonic and hypertonic conditions. HeLa cells were transfected with C-terminal GFP-tagged NFAT5a and were subjected to 1 h salt stress (350 mOsmol NaCl). Squares indicate areas of interest. The ER was stained with anti-PDI antibodies, the Golgi was stained with Giantin, and the plasma membrane (PM) was stained with wheat germ agglutinin Alexa 555 (red). NFAT5a co-localizes with the ER and the Golgi under isotonic- (no salt) and hypertonic-conditions (salt stress) to a similar extent. Co-localization with the PM is dramatically diminished under salt stress (Scale bars10 µm). Full-size images are available athttp://mendel.bii.a-star.edu.sg/SEQUENCES/NFAT5_2011/.
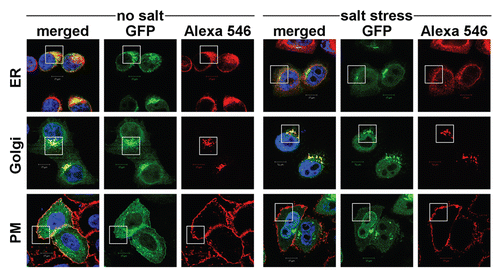
Figure 5 Localization studies of NFAT5a under isotonic and hypertonic conditions. HeLa cells were transfected with C-terminal GFP-tagged NFAT5a and were subjected to 1 h salt stress (350 mOsmol NaCl). Squares indicate areas of interest. The ER was stained with anti-PDI antibodies, the Golgi was stained with Giantin, and the plasma membrane (PM) was stained with wheat germ agglutinin Alexa 555 (red). NFAT5a co-localizes with the ER and the Golgi under isotonic- (no salt) and hypertonic-conditions (salt stress) to a similar extent. Co-localization with the PM is dramatically diminished under salt stress (Scale bars10 µm). Full-size images are available athttp://mendel.bii.a-star.edu.sg/SEQUENCES/NFAT5_2011/.

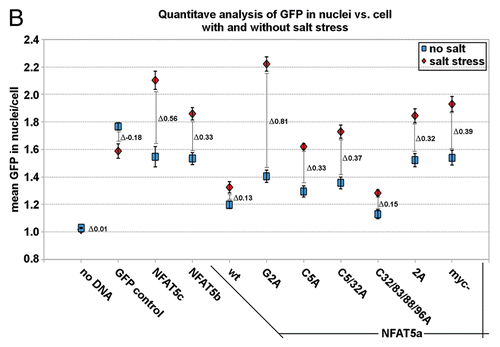
Figure 6 Live cell imaging of the nuclear import of NFAT5 isoforms under salt stress. (A) Representative live cell images from each construct at time points 0, 3, 15 and 30 min after salt stress (350 mOsmol NaCl). HeLa cells were transfected with NFAT5a/b/c-GFP and pEGFP-N3 (GFP control). The images show that NFAT5b and c shuttle into the nucleus nearly completely in 30 min. For NFAT5a, a significant part did remain in the cytoplasm. GFP control does not change the localization pattern. The cell nuclei (blue) were stained after the time course was completed (Scale bars-10 µm). Full-size images and movies are available athttp://mendel.bii.a-star.edu.sg/SEQUENCES/NFAT5_2011/. Methodical detail of the image analysis proceduresis provided inSupplemental Material B. (B) The graph shows the statistical analysis of the mean GFP values in the nucleus vs. the cell of the in vivo imaging experiment. The slope for NFAT5b and c is steeper than the one for NFAT5a.
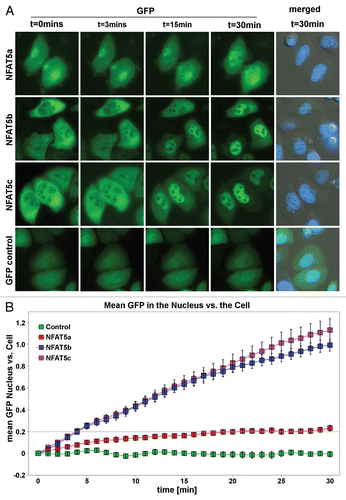
Figure 6 Live cell imaging of the nuclear import of NFAT5 isoforms under salt stress. (A) Representative live cell images from each construct at time points 0, 3, 15 and 30 min after salt stress (350 mOsmol NaCl). HeLa cells were transfected with NFAT5a/b/c-GFP and pEGFP-N3 (GFP control). The images show that NFAT5b and c shuttle into the nucleus nearly completely in 30 min. For NFAT5a, a significant part did remain in the cytoplasm. GFP control does not change the localization pattern. The cell nuclei (blue) were stained after the time course was completed (Scale bars-10 µm). Full-size images and movies are available athttp://mendel.bii.a-star.edu.sg/SEQUENCES/NFAT5_2011/. Methodical detail of the image analysis proceduresis provided inSupplemental Material B. (B) The graph shows the statistical analysis of the mean GFP values in the nucleus vs. the cell of the in vivo imaging experiment. The slope for NFAT5b and c is steeper than the one for NFAT5a.

Figure 7 Anchoring of NFAT5 isoforms to the PM with the AP MAP N terminus. Selected subset of confocal images of HeLa cells transiently transfected with the following GFP-tagged (green) constructs: isoforms NFAT5a/b/c, AP MAP (AA1–61) (control), AP MAP (AA1–61)-NFAT5a/b/c. Salt stress (350 mM NaCl) was applied for 1 h. Nuclei were stained with DAP I (blue). Full-size images are available onhttp://mendel.bii.a-star.edu.sg/SEQUENCES/NFAT5_2011/. APMAP (AA1–61) represent the transmembrane region of APMAP for anchoring at the PM. All NFAT5 isoforms shuttle into the nucleus upon salt stress. No shuttling is observed after anchoring them to the PM (Scale bars 10 µm).

Figure 7 Anchoring of NFAT5 isoforms to the PM with the AP MAP N terminus. Selected subset of confocal images of HeLa cells transiently transfected with the following GFP-tagged (green) constructs: isoforms NFAT5a/b/c, AP MAP (AA1–61) (control), AP MAP (AA1–61)-NFAT5a/b/c. Salt stress (350 mM NaCl) was applied for 1 h. Nuclei were stained with DAP I (blue). Full-size images are available onhttp://mendel.bii.a-star.edu.sg/SEQUENCES/NFAT5_2011/. APMAP (AA1–61) represent the transmembrane region of APMAP for anchoring at the PM. All NFAT5 isoforms shuttle into the nucleus upon salt stress. No shuttling is observed after anchoring them to the PM (Scale bars 10 µm).

Figure 8 Mechanisms for the mobilization of TFs for nuclear import. (A) IκB prevents NFκB from entering the nucleus by masking its NLS. (B) The sterol regulatory element binding protein (SREBP) is retained at the ER via two transmembrane domains until its transcriptional active part gets cleaved off via two proteolytical cleavages. (C) A TF such as NFAT5a is attached to the plasma membrane via two lipid anchors. A stimulatory signal that causes its depalmitoylation allows its dissociation from the membrane and nuclear import.

Figure 8 Mechanisms for the mobilization of TFs for nuclear import. (A) IκB prevents NFκB from entering the nucleus by masking its NLS. (B) The sterol regulatory element binding protein (SREBP) is retained at the ER via two transmembrane domains until its transcriptional active part gets cleaved off via two proteolytical cleavages. (C) A TF such as NFAT5a is attached to the plasma membrane via two lipid anchors. A stimulatory signal that causes its depalmitoylation allows its dissociation from the membrane and nuclear import.

Table 1 Transcripts of NFAT5

Supplemental material

Additional material

Download Zip (746 KB)