Figures & data
Figure 1 TOMM20, a mitochondrial marker protein, is preferentially expressed in human epithelial cancer cells, in breast cancer patients. Paraffin-embedded sections of human breast cancer samples lacking stromal Cav-1 were immuno-stained with antibodies directed against TOMM20 (brown color). Slides were then counter-stained with hematoxylin (blue color). Note that TOMM20 is highly expressed in the epithelial compartment of human breast cancers that lack stromal Cav-1. Two representative images are shown. Original magnification, 40x and 60x, as indicated.
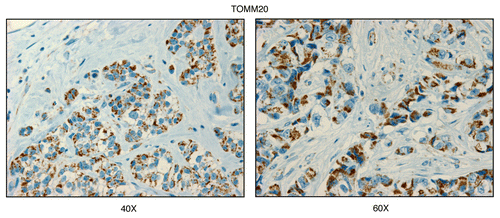
Figure 2 Cathepsin B, a lysosomal protease and autophagy marker, is selectively increased in the stroma of human breast cancers. Paraffin-embedded sections of human breast cancer samples lacking stromal Cav-1 were immuno-stained with antibodies directed against Cathepsin B. Slides were then counter-stained with hematoxylin. Note that Cathepsin B is highly expressed in the stromal compartment of human breast cancers that lack stromal Cav-1. Two representative images are shown. Original magnification, 40x and 60x, as indicated.
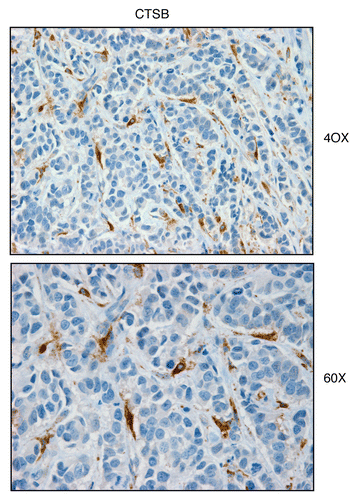
Figure 3 BNIP3L, a mitophagy marker, is elevated in the stroma of human breast cancers. Paraffin-embedded sections of human breast cancer samples lacking stromal Cav-1 were immuno-stained with antibodies directed against BNIP3L. Slides were then counter-stained with hematoxylin. Note that BNIP3L is highly expressed in the stromal compartment of human breast cancers that lack stromal Cav-1. Two representative images are shown. Original magnification, 40x and 60x, as indicated.
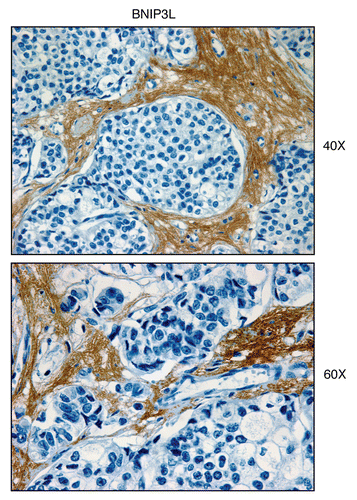
Figure 4 MCT4, a marker of aerobic glycolysis and lactate efflux, is elevated in the stroma of human breast cancers. Paraffin-embedded sections of human breast cancer samples lacking stromal Cav-1 were immuno-stained with antibodies directed against MCT4. Slides were then counter-stained with hematoxylin. Note that MCT4 is highly expressed in the stromal compartment of human breast cancers that lack stromal Cav-1. Three representative images are shown. Original magnification, 40x and 60x, as indicated.
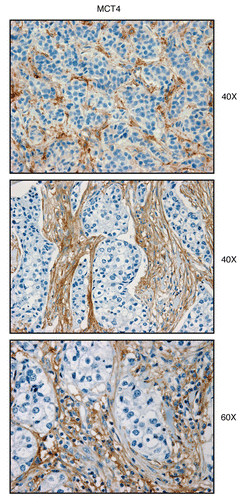
Figure 5 Visualizing mitochondrial complex IV (COX) activity in murine skeletal muscle tissue. Frozen sections of murine skeletal muscle (hind-limb/gastronemius) were subjected to COX activity staining (brown color). Slides were then counter-stained with hematoxylin (blue color). Note that slow-twitch fibers (type I) are oxidative, are mitochondria-rich, and are COX-positive (see red arrows). In contrast, fast-twitch fibers (type II) are glycolytic, are mitochondria-poor, and are COX-negative. Two representative images are shown. Original magnification, 20x and 40x, as indicated.
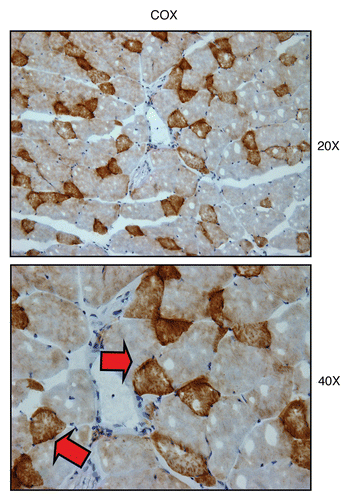
Figure 6 Mitochondrial complex IV (COX) activity is amplified in human epithelial cancer cells, in breast cancer patients (low-power images). Frozen sections of human breast cancer samples were subjected to COX activity staining (brown color). Slides were then counter-stained with hematoxylin (blue color). Note that human epithelial tumor cells are intensely stained, as compared with adjacent stromal cells, which show little or no COX activity, in comparison. Original magnification, 20x, as indicated.
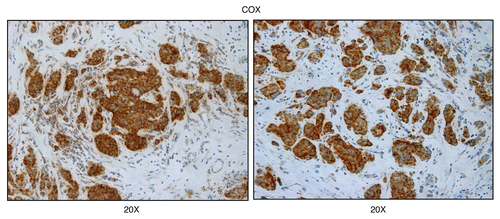
Figure 7 Mitochondrial complex IV (COX) activity is amplified in human epithelial cancer cells, in breast cancer patients (higher-power images). As in , except higher power images are shown. Note that human epithelial cancer cell “nests” are intensely stained, as compared with adjacent stromal cells. Original magnification, 40x, as indicated.
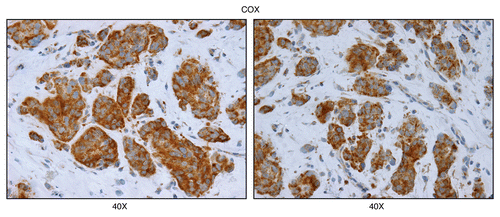
Figure 8 COX activity is higher in human epithelial cancer cells, relative to normal adjacent epithelial ductal cells. Frozen sections of human breast cancer samples were subjected to COX activity staining (brown color). Slides were then counter-stained with hematoxylin (blue color). Note that epithelial cancer cells were also more intensely stained than adjacent normal epithelial cells that were part of mammary ductal tissue. Thus, COX activity staining can be used to distinguish normal epithelial cells from adjacent cancer cells, within the same tumor tissue. Original magnification, 20x and 40x, as indicated.
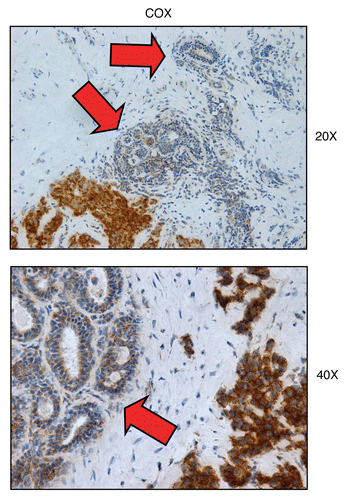
Figure 9 Mitochondrial poisons (azide and metformin) validate the specificity of COX activity staining in human epithelial cancer cells. Serial frozen sections of human breast cancer samples were subjected to COX activity staining (brown color). Slides were then counter-stained with hematoxylin (blue color). Note that sodium azide (1 mM; a Complex IV inhibitor) effectively abolished the COX activity staining, directly demonstrating high-specificity. Treatment with metformin (1 mM; a Complex I inhibitor) also significantly reduced the COX activity staining (Complex IV).
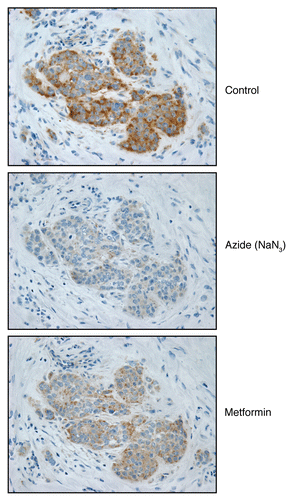
Figure 10 Visualizing mitochondrial complex I (NADH) activity in murine skeletal muscle tissue. Frozen sections of murine skeletal muscle (hind-limb/gastronemius) were subjected to NADH activity staining (blue color). Slides were then counter-stained with nuclear fast-red (pink color). Note that slow-twitch fibers (type I) are oxidative, are mitochondria-rich, and are NADH-positive (see red arrows). In contrast, fast-twitch fibers (type II) are glycolytic, are mitochondria-poor, and are NADH-negative. Two representative images are shown. Original magnification, 20x and 40x, as indicated.
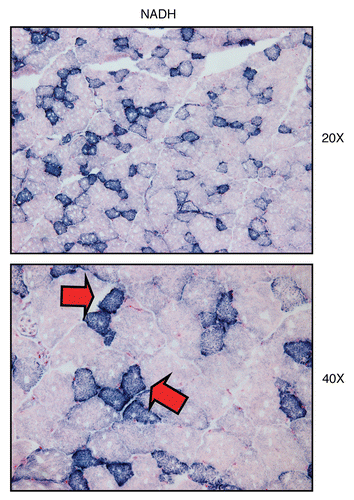
Figure 11 Mitochondrial complex I (NADH) activity is amplified in human epithelial cancer cells, in breast cancer patients. Frozen sections of human breast cancer samples were subjected to NADH activity staining (blue color). However, slides were not counter-stained with nuclear fast-red (pink color), and were mounted without counter-staining, to better visualize the blue reaction product. Note that human epithelial tumor cells are intensely stained dark blue (see red arrows), as compared with adjacent stromal cells, which show little or no NADH activity, in comparison. Original magnification, 40x, as indicated.
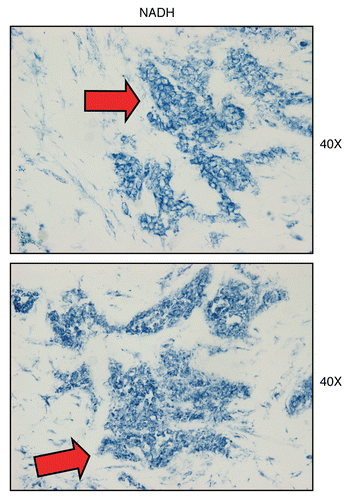
Figure 12 Treatment with metformin (a complex I inhibitor) validates the specificity of NADH activity staining in human epithelial cancer cells. Frozen sections of human breast cancer samples were subjected to NADH activity staining (blue color) in the presence or absence of metformin. However, slides were not counter-stained with nuclear fast-red (pink color), and were mounted without counter-staining, to better visualize the blue reaction product. Note that meformin (1 mM; a Complex I inhibitor) effectively abolished the NADH activity staining, directly demonstrating high-specificity. Original magnification, 40x.
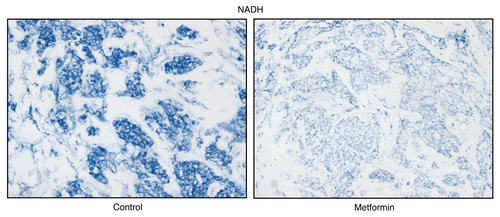
Figure 13 Visualizing mitochondrial complex II (SDH) activity in murine skeletal muscle tissue. Frozen sections of murine skeletal muscle (hind-limb/gastronemius) were subjected to SDH activity staining (blue color). Note that slow-twitch fibers (type I) are oxidative, are mitochondria-rich, and are SDH-positive (see red arrows). In contrast, fast-twitch fibers (type II) are glycolytic, are mitochondria-poor, and are SDH-negative. Two representative images are shown. Original magnification, 20x and 40x, as indicated.
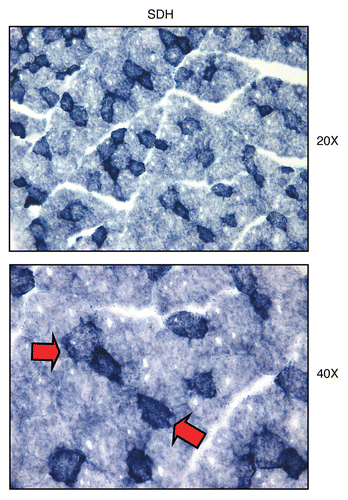
Figure 14 Mitochondrial complex II (SDH) activity is amplified in human epithelial cancer cells, in breast cancer patients. Frozen sections of human breast cancer samples were subjected to SDH activity staining (blue color). However, slides were not counter-stained. Note that human epithelial tumor cells are intensely stained dark blue, as compared with adjacent stromal cells, which show little or no SDH activity, in comparison. Original magnification, 40x, as indicated.
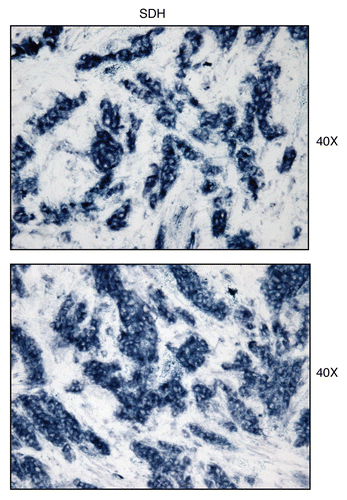
Figure 15 Treatment with malonate (a complex II inhibitor) validates the specificity of SDH activity staining in human epithelial cancer cells. Frozen sections of human breast cancer samples were subjected to SDH activity staining (blue color) in the presence or absence of malonate. However, slides were not counter-stained. Note that sodium malonate (10 mM; a Complex II inhibitor) effectively abolished the SDH activity staining, directly demonstrating high-specificity. Original magnification, 40x.
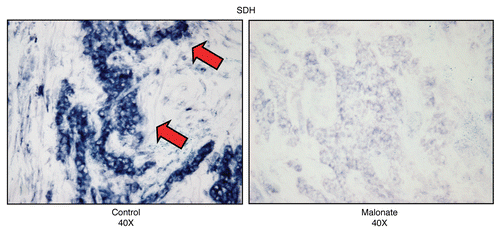
Figure 16 Complex IV (MT-CO1), a component of the respiratory chain, is preferentially expressed in human epithelial cancer cells, in breast cancer patients. Paraffin-embedded sections of human breast cancer samples lacking stromal Cav-1 were immuno-stained with antibodies directed against Complex IV (MT-CO1) (brown color). Slides were then counter-stained with hematoxylin (blue color). Note that Complex IV is highly expressed in the epithelial compartment of human breast cancers that lack stromal Cav-1. Two representative images are shown. Original magnification, 40x, as indicated.
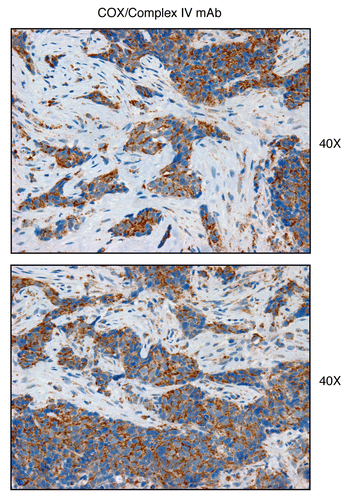
Figure 17 Complex II (SDH-B), a component of the respiratory chain, is preferentially expressed in human epithelial cancer cells, in breast cancer patients. Paraffin-embedded sections of human breast cancer samples lacking stromal Cav-1 were immuno-stained with antibodies directed against Complex II (SDH-B) (brown color). Slides were then counter-stained with hematoxylin (blue color). Note that Complex II is highly expressed in the epithelial compartment of human breast cancers that lack stromal Cav-1. Two representative images are shown. Original magnification, 40x, as indicated.
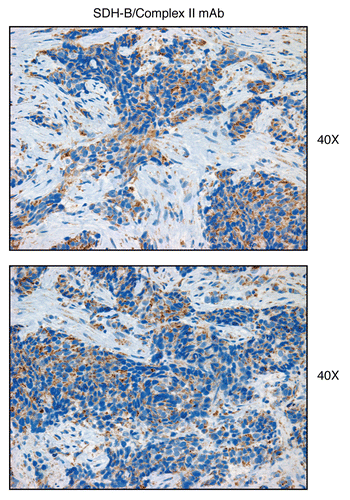
Figure 18 An epithelial-specific mitochondrial gene signature predicts metastasis in breast cancer patients. We examined whether a 38-member MITO/OXPHOS gene signature (see for the complete list) is associated with the transcriptional profiles of human breast cancer tumor tissue. This signature contains mitochondrial associated gene transcripts specifically upregulated only in epithelial breast cancer cells, and not in adjacent stromal tissue. (A) Box Plot. Note that this epithelial-specific mitochondrial gene signature is upregulated in human breast tumors (>2,000 cases examined, with a p value < 10−20), relative to normal healthy breast tissue (102 controls). In addition, significant associations were obtained with tumor tissue from both ER-positive (>1,600 cases examined, p < 10−20) and ER-negative (nearly 500 cases examined, p < 10−10) breast cancer patients. Thus, upregulation of this MITO/OXPHOS gene signature is a general feature of human breast cancers. (B) Kaplan-Meier Analysis. Note that this mitochondrial-based epithelial gene signature also predicts breast cancer cell metastasis, and especially in ER-negative patients. In this patient group, the MITO/OXPHOS signature was associated with a near 30% increase is metastasis, over a 10-year follow-up period. Numbers of cases with annotation are shown.
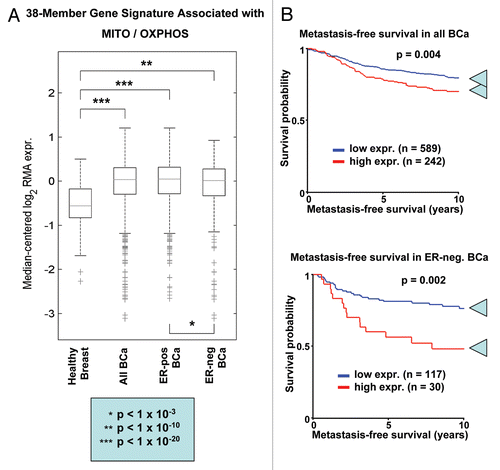
Figure 19 Energy transfer in cancer metabolism. We have recently proposed a new paradigm for understanding energy transfer in cancer metabolism. In this model, cancer cells behave as metabolic parasites, by extracting nutrients from normal host cells, such as fibroblasts, by secreting hydrogen peroxide. Oxidative stress in the tumor microenvironment leads to autophagy, mitophagy and aerobic glycolysis. This, in turn, produces high-energy nutrients (such as L-lactate, ketones and glutamine) that fuel the anabolic growth of tumor cells, via oxidative mitochondrial metabolism (OXPHOS ). Thus, cancer cells and the tumor stroma are metabolically coupled in a type of symbiotic or host-parasite relationship. In accordance with this model, here we provide evidence that cancer-associated fibroblasts undergo autophagy, mitophagy and secrete lactate, while epithelial cancer cells are rich in functional mitochondria.
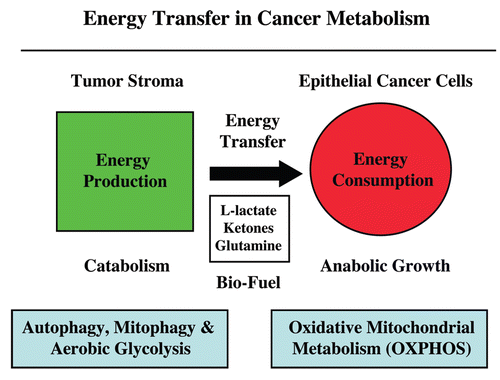
Table 1 An epithelial-specific mitochondrial gene signature in breast cancer