2,049
Views
50
CrossRef citations to date
0
Altmetric
Report

The mitochondrial protein C1qbp promotes cell proliferation, migration and resistance to cell death

Pages 4119-4127 | Received 10 Jun 2011, Accepted 03 Oct 2011, Published online: 01 Dec 2011

Figures & data

Figure 1 C1qbp suppresses staurosporine-induce apoptosis in fibroblasts. (A) Mouse embryonic fibroblasts (MEFs) were infected with an adenovirus encoding Myc-tagged C1qbp, or β-galactosidase (β-gal, control) and then protein gel blotted for Myc, cleaved caspase-3 and cleaved PARP following exposure to 300 nM staurosporine for 18 h. GAPDH was used to demonstrate equivalent loading. (B) TUNEL staining in the infected MEFs exposed to increasing concentrations of staurosporine for 18 h. (C) MEFs were transfected with 100 nM of control (Con) or C1qbp-specific siRNA and protein gel blotted for C1qbp, cleaved caspase-3, cleaved PARP and GAPDH following exposure to 300 nM staurosporine for 18 h. (D) TUNEL staining in the siRNA-transfected MEFs exposed to increasing concentrations of staurosporine for 18 hrs. The results shown are representative of 3 and 4 independent experiments performed in duplicate. Error bars indicate SEM and *p < 0.05 vs. β-gal or Con siRNA.
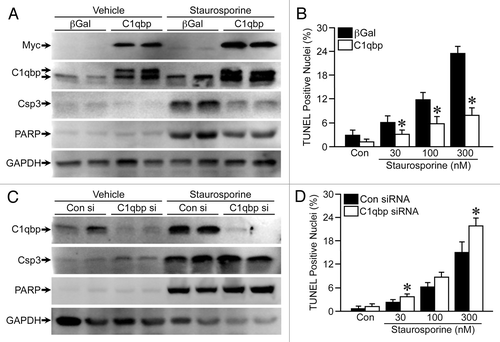
Figure 1 C1qbp suppresses staurosporine-induce apoptosis in fibroblasts. (A) Mouse embryonic fibroblasts (MEFs) were infected with an adenovirus encoding Myc-tagged C1qbp, or β-galactosidase (β-gal, control) and then protein gel blotted for Myc, cleaved caspase-3 and cleaved PARP following exposure to 300 nM staurosporine for 18 h. GAPDH was used to demonstrate equivalent loading. (B) TUNEL staining in the infected MEFs exposed to increasing concentrations of staurosporine for 18 h. (C) MEFs were transfected with 100 nM of control (Con) or C1qbp-specific siRNA and protein gel blotted for C1qbp, cleaved caspase-3, cleaved PARP and GAPDH following exposure to 300 nM staurosporine for 18 h. (D) TUNEL staining in the siRNA-transfected MEFs exposed to increasing concentrations of staurosporine for 18 hrs. The results shown are representative of 3 and 4 independent experiments performed in duplicate. Error bars indicate SEM and *p < 0.05 vs. β-gal or Con siRNA.
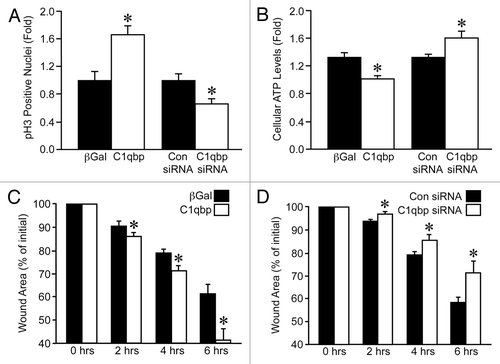
Figure 2 C1qbp promotes proliferation and migration in fibroblasts. (A) Phospho-histone H3 (pH3) staining, a marker of cell proliferation, in MEFs either infected with β-galactosidase (β-gal) or C1qbp adenoviruses or transfected with control (Con) or C1qbp siRNAs. (B) ATP levels in the virus-infected and siRNA-transfected MEFs. (C) Wound-healing assay in MEFs infected with either β-gal or C1qbp adenoviruses. (D) Wound-healing assay in MEFs transfected with either Con or C1qbp siRNAs. The results shown are representative of 3 and 4 independent experiments performed in duplicate. Error bars indicate SEM and *p < 0.05 vs. β-gal or Con siRNA.

Figure 2 C1qbp promotes proliferation and migration in fibroblasts. (A) Phospho-histone H3 (pH3) staining, a marker of cell proliferation, in MEFs either infected with β-galactosidase (β-gal) or C1qbp adenoviruses or transfected with control (Con) or C1qbp siRNAs. (B) ATP levels in the virus-infected and siRNA-transfected MEFs. (C) Wound-healing assay in MEFs infected with either β-gal or C1qbp adenoviruses. (D) Wound-healing assay in MEFs transfected with either Con or C1qbp siRNAs. The results shown are representative of 3 and 4 independent experiments performed in duplicate. Error bars indicate SEM and *p < 0.05 vs. β-gal or Con siRNA.

Figure 3 Mitochondrial C1qbp is upregulated in human breast cancer cells and tumors. (A) Protein gel blotting for C1qbp in the normal breast epithelial line MCF12A and in the MCF7, BT474, T47D and MDA-MB-231 breast cancer cell lines. GAPDH was used as a loading control. The results shown are representative of 3 and 4 independent experiments performed in duplicate. (B–G) Fluorescent immunohistochemical staining for C1qbp in sections from: (B and C) normal human breast tissue; (D and E) breast invasive ductal carcinoma and (F and G) breast mucous adenocarcinoma. Results are representative of staining from 4 different patient samples in each group.
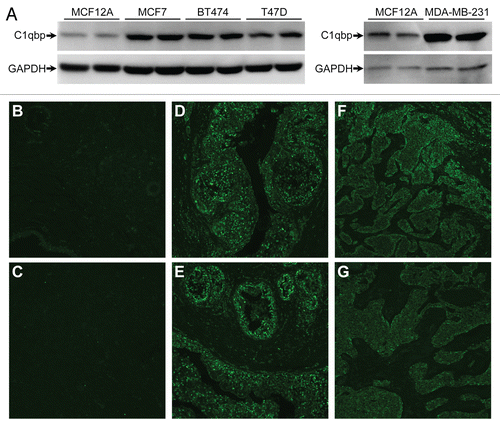
Figure 3 Mitochondrial C1qbp is upregulated in human breast cancer cells and tumors. (A) Protein gel blotting for C1qbp in the normal breast epithelial line MCF12A and in the MCF7, BT474, T47D and MDA-MB-231 breast cancer cell lines. GAPDH was used as a loading control. The results shown are representative of 3 and 4 independent experiments performed in duplicate. (B–G) Fluorescent immunohistochemical staining for C1qbp in sections from: (B and C) normal human breast tissue; (D and E) breast invasive ductal carcinoma and (F and G) breast mucous adenocarcinoma. Results are representative of staining from 4 different patient samples in each group.

Figure 4 Knockdown of C1qbp reduces proliferation in MDA-MB-231 breast cancer cells. (A) MDA-MB-231 cells were stably transfected with either a control shRNA (Con) or one of 3 different C1qbp-specific shRNAs and then protein gel blotted for C1qbp. GAPDH was used as a loading control. (B) Quantification of the efficiency of C1qbp knockdown in the MDA-MB-231 shRNA cell lines. (C) Each of the MDA-MB-231 shRNA cell lines was plated at an equal density, and the increase in cell numbers after 48 hrs measured by bis-benzamide staining of the nuclei. (D) ATP levels in the control and C1qbp shRNA MDA-MB-231 cell lines. The results shown are representative of 3 and 4 independent experiments performed in duplicate. Error bars indicate SEM and *p < 0.05 vs. Con sh.
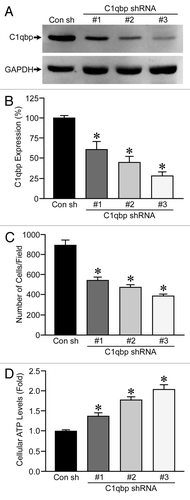
Figure 4 Knockdown of C1qbp reduces proliferation in MDA-MB-231 breast cancer cells. (A) MDA-MB-231 cells were stably transfected with either a control shRNA (Con) or one of 3 different C1qbp-specific shRNAs and then protein gel blotted for C1qbp. GAPDH was used as a loading control. (B) Quantification of the efficiency of C1qbp knockdown in the MDA-MB-231 shRNA cell lines. (C) Each of the MDA-MB-231 shRNA cell lines was plated at an equal density, and the increase in cell numbers after 48 hrs measured by bis-benzamide staining of the nuclei. (D) ATP levels in the control and C1qbp shRNA MDA-MB-231 cell lines. The results shown are representative of 3 and 4 independent experiments performed in duplicate. Error bars indicate SEM and *p < 0.05 vs. Con sh.

Figure 5 Knockdown of C1qbp reduces migration and resistance to doxorubicin in MDA-MB-231 breast cancer cells. (A) Wound-healing assay in MDA-MB-231 cells stably transfected with either a control shRNA (Con) or one of 3 different C1qbp-specific shRNAs. (B) TUNEL staining in the different MDA-MB-231 shRNA cell lines at baseline and following exposure to 2 µM doxorubicin for 24 h. The results shown are representative of 3 and 4 independent experiments performed in duplicate. Error bars indicate SEM and *p < 0.05 vs. Con shRNA.
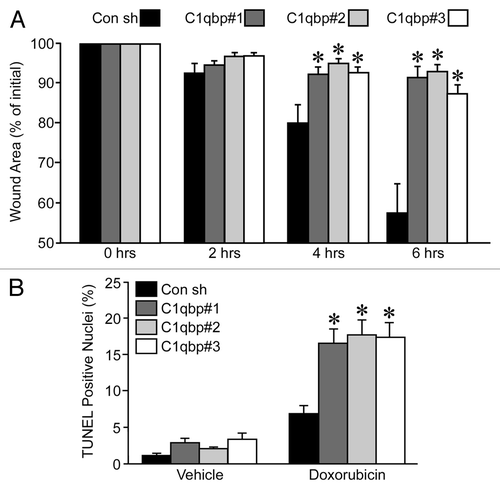
Figure 5 Knockdown of C1qbp reduces migration and resistance to doxorubicin in MDA-MB-231 breast cancer cells. (A) Wound-healing assay in MDA-MB-231 cells stably transfected with either a control shRNA (Con) or one of 3 different C1qbp-specific shRNAs. (B) TUNEL staining in the different MDA-MB-231 shRNA cell lines at baseline and following exposure to 2 µM doxorubicin for 24 h. The results shown are representative of 3 and 4 independent experiments performed in duplicate. Error bars indicate SEM and *p < 0.05 vs. Con shRNA.

Figure 6 C1qbp is upregulated in human lung and colon cancer cell lines and tumors. (A) Protein gel blotting for C1qbp in the normal lung Wi38 cell line and in the H441, Calu-6 and A549 lung cancer cell lines. GAPDH was used as a loading control. (B) Protein gel blotting for C1qbp and GAPDH in the normal colon FHC cell line and in the HT-29 and HCT-116 colon cancer cell lines. (C–F) Fluorescent immunostaining for C1qbp in sections from: (C) normal human lung tissue; (D) small cell lung carcinoma; (E) normal human colon tissue and (F) colon invasive adenocarcinoma (well differentiated, mucinous). The results shown are representative of 3 and 4 independent experiments performed in duplicate (cell lines) or 4 different patient samples (tumors).
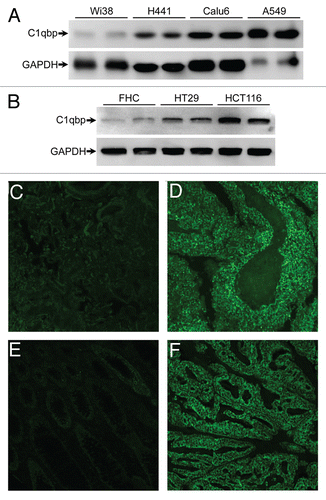
Figure 6 C1qbp is upregulated in human lung and colon cancer cell lines and tumors. (A) Protein gel blotting for C1qbp in the normal lung Wi38 cell line and in the H441, Calu-6 and A549 lung cancer cell lines. GAPDH was used as a loading control. (B) Protein gel blotting for C1qbp and GAPDH in the normal colon FHC cell line and in the HT-29 and HCT-116 colon cancer cell lines. (C–F) Fluorescent immunostaining for C1qbp in sections from: (C) normal human lung tissue; (D) small cell lung carcinoma; (E) normal human colon tissue and (F) colon invasive adenocarcinoma (well differentiated, mucinous). The results shown are representative of 3 and 4 independent experiments performed in duplicate (cell lines) or 4 different patient samples (tumors).
Supplemental material

Additional material

Download Zip (2.1 MB)

Reprints and Corporate Permissions

Please note: Selecting permissions does not provide access to the full text of the article, please see our help page How do I view content?

To request a reprint or corporate permissions for this article, please click on the relevant link below:

Academic Permissions

Please note: Selecting permissions does not provide access to the full text of the article, please see our help page How do I view content?

Obtain permissions instantly via Rightslink by clicking on the button below:

If you are unable to obtain permissions via Rightslink, please complete and submit this Permissions form. For more information, please visit our Permissions help page.