1,889
Views
131
CrossRef citations to date
0
Altmetric
Extra Views

New insights into replication origin characteristics in metazoans

, , , , , & show all
Pages 658-667 | Received 15 Dec 2011, Accepted 16 Dec 2011, Published online: 15 Feb 2012

Figures & data

Figure 1 Metazoan replication origins (Oris) contain an Origin G-rich repeated element (OGRE ). (A) Description of the consensus elements (OGRE ) found in Oris from mouse ES (left part) and Drosophila Kc cells (right part). Venn diagrams illustrate the association between Oris in mouse ES (B) and Drosphila Kc cells (C) and OGRE occurrences. (D) Presence of the mouse OGRE motif in Oris mapped in the ENCODE regions of HeLa cells. The proportion of OGRE-positive and -negative Oris is indicated. (E) OGRE density correlates with Oris density and early replication timing.
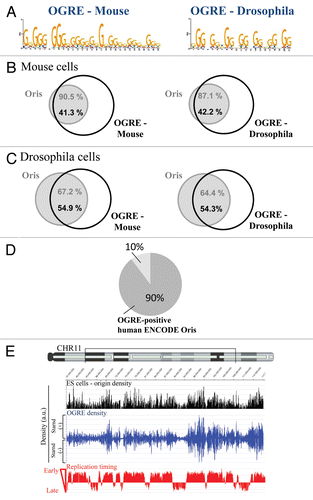
Figure 1 Metazoan replication origins (Oris) contain an Origin G-rich repeated element (OGRE ). (A) Description of the consensus elements (OGRE ) found in Oris from mouse ES (left part) and Drosophila Kc cells (right part). Venn diagrams illustrate the association between Oris in mouse ES (B) and Drosphila Kc cells (C) and OGRE occurrences. (D) Presence of the mouse OGRE motif in Oris mapped in the ENCODE regions of HeLa cells. The proportion of OGRE-positive and -negative Oris is indicated. (E) OGRE density correlates with Oris density and early replication timing.

Figure 2 OGRE is localized upstream of metazoan Ori peaks. Nascent Strands (NS) enrichment at OGRE is shown for mouse (A) and Drosophila (B) cells. A strong NS peak is found ∼280 and ∼160 nucleotides 3′ of the overall mouse or Drosophila OGRE occurrences, respectively. NS signals were not associated with randomized OGRE occurrences. The enrichment value is the negative log of the combined p-value associated with the NS signal. (C) OGRE-positive mouse Oris were aligned and centered on the NS peaks. The nucleotide distribution was calculated ±1 kb of the NS peak. Note the presence of G-(black) and C-rich (blue) sequences 5′ and 3′ of the NS peaks. In this situation, Oris were not oriented relative to the OGREs. (D) When mouse Oris were oriented relative to the OGRE s, the nucleotide distribution around NS peaks was characterized by the presence of a strong G-rich strand (black) 5′ of the NS peak. (E) Schematic representation of OGRE organization relative to the NS peak.
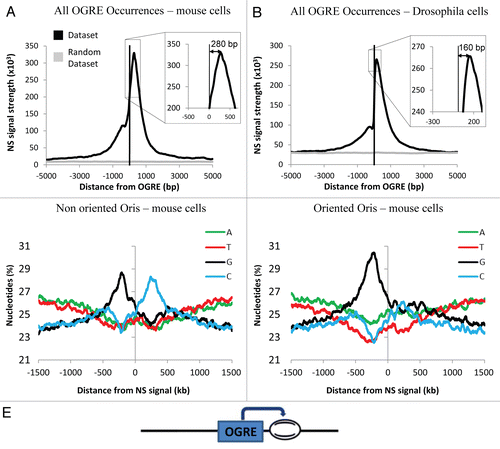
Figure 2 OGRE is localized upstream of metazoan Ori peaks. Nascent Strands (NS) enrichment at OGRE is shown for mouse (A) and Drosophila (B) cells. A strong NS peak is found ∼280 and ∼160 nucleotides 3′ of the overall mouse or Drosophila OGRE occurrences, respectively. NS signals were not associated with randomized OGRE occurrences. The enrichment value is the negative log of the combined p-value associated with the NS signal. (C) OGRE-positive mouse Oris were aligned and centered on the NS peaks. The nucleotide distribution was calculated ±1 kb of the NS peak. Note the presence of G-(black) and C-rich (blue) sequences 5′ and 3′ of the NS peaks. In this situation, Oris were not oriented relative to the OGREs. (D) When mouse Oris were oriented relative to the OGRE s, the nucleotide distribution around NS peaks was characterized by the presence of a strong G-rich strand (black) 5′ of the NS peak. (E) Schematic representation of OGRE organization relative to the NS peak.

Figure 3 CpG Islands (CGI) and OGRE predict metazoan Oris. (A) Association of mouse ES cell Oris with all OGRE occurrences (left part) and with CGI-positive (middle part) or CGI-negative (right part) OGRE occurrences. (B) The Nascent Strands (NS) enrichment at CGI-positive (upper part) and CGI-negative (lower part) OGRE occurrences is shown. Note that the dual peak is only seen in the CGI-positive OGRE occurrences. (C) The presence of OGRE occurrences on both strands (bidirectional OGRE ) and on one strand (unidirectional OGRE ) was analyzed for CGI-positive (upper part) and CGI-negative (lower part) Oris. Note that CGI-positive Oris tend to have more OGRE occurrences on both strands (upper part), whereas CGI-negative Oris usually have occurrences only on one strand (lower part). (D) Schematic representation of OGRE organization relative to the NS peaks.
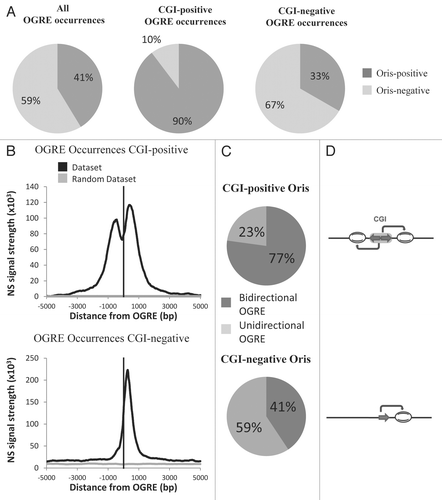
Figure 3 CpG Islands (CGI) and OGRE predict metazoan Oris. (A) Association of mouse ES cell Oris with all OGRE occurrences (left part) and with CGI-positive (middle part) or CGI-negative (right part) OGRE occurrences. (B) The Nascent Strands (NS) enrichment at CGI-positive (upper part) and CGI-negative (lower part) OGRE occurrences is shown. Note that the dual peak is only seen in the CGI-positive OGRE occurrences. (C) The presence of OGRE occurrences on both strands (bidirectional OGRE ) and on one strand (unidirectional OGRE ) was analyzed for CGI-positive (upper part) and CGI-negative (lower part) Oris. Note that CGI-positive Oris tend to have more OGRE occurrences on both strands (upper part), whereas CGI-negative Oris usually have occurrences only on one strand (lower part). (D) Schematic representation of OGRE organization relative to the NS peaks.

Figure 4 OGREs are predicted to have high intrinsic nucleosome occupancy. The average predicted intrinsic nucleosome occupancy was computed for a 1 kb around the most significant OGRE occurrences associated with Oris. Shown is the predicted average occupancy for mouse (A) and Drosophila (B) Oris centered on the mouse OGRE motif. As a control, a similar number of sites were distributed randomly and the average nucleosome occupancy was calculated around these sites. The control randomization was repeated 20 times and its mean and standard deviation are plotted in red and green, respectively. Nucleosome occupancy was normalized to the mean genome occupancy that is 1.
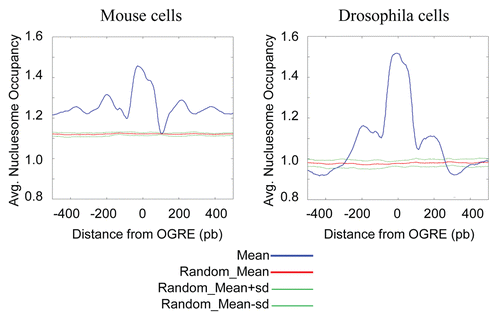
Figure 4 OGREs are predicted to have high intrinsic nucleosome occupancy. The average predicted intrinsic nucleosome occupancy was computed for a 1 kb around the most significant OGRE occurrences associated with Oris. Shown is the predicted average occupancy for mouse (A) and Drosophila (B) Oris centered on the mouse OGRE motif. As a control, a similar number of sites were distributed randomly and the average nucleosome occupancy was calculated around these sites. The control randomization was repeated 20 times and its mean and standard deviation are plotted in red and green, respectively. Nucleosome occupancy was normalized to the mean genome occupancy that is 1.

Figure 5 G-quadruplexes are specifically found in the majority of metazoan Oris, in association with the OGRE motif. (A) Definition of the G-quadruplexes (G4) that were used in this study. (B) Venn diagram showing the association of OGRE occurrences and G4 in mouse chromosome 11. (C) Predicted G4 formed by an Oris-associated OGRE occurrence. (D) The association between Oris and G4 are illustrated with a Venn diagram. (E) Repartition of Oris from mouse ES cells based on to the presence of OGRE s and/or G4. (F) The nascent Strands (NS) enrichment around G4 occurrences is shown. A strong NS peak is found ∼260 nucleotides downstream of the G4. A small NS peak is also observed upstream similarly to what described for OGRE s (see and B).
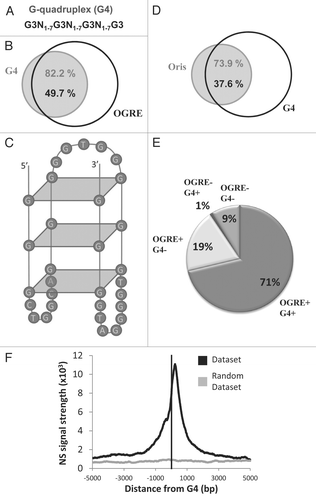
Figure 5 G-quadruplexes are specifically found in the majority of metazoan Oris, in association with the OGRE motif. (A) Definition of the G-quadruplexes (G4) that were used in this study. (B) Venn diagram showing the association of OGRE occurrences and G4 in mouse chromosome 11. (C) Predicted G4 formed by an Oris-associated OGRE occurrence. (D) The association between Oris and G4 are illustrated with a Venn diagram. (E) Repartition of Oris from mouse ES cells based on to the presence of OGRE s and/or G4. (F) The nascent Strands (NS) enrichment around G4 occurrences is shown. A strong NS peak is found ∼260 nucleotides downstream of the G4. A small NS peak is also observed upstream similarly to what described for OGRE s (see Fig. 2A and B).