797
Views
39
CrossRef citations to date
0
Altmetric
Report

Transient overexpression of cyclin D2/CDK4/GLP1 genes induces proliferation and differentiation of adult pancreatic progenitors and mediates islet regeneration

, , , &
Pages 695-705 | Received 24 Oct 2011, Accepted 19 Dec 2011, Published online: 15 Feb 2012

Figures & data

Figure 1 Triple staining for pancreas tissue at magnification of 200x. Anti-insulin (green), Anti-glucagon (red), and anti-nuclear (blue) antibodies were used. Upper left: normal pancreatic islet; Upper middle: STZ treated; Upper right: STZ plus RIP-DsRed; Middle left: RIP-cyclin D2 treated; Middle center: RIP-CDK4 treated; Middle right: RIP-GLP1 treated; Lower left: RIP-cyclin D2/CDK4 treated; Lower center: RIP-cyclin D2/CDK4/GLP1 treated; Lower right: H&E staining for similar slide of RIP-cyclin D2/CDK4/GLP1. Figure at the bottom is the β cell fraction, *p < 0.05; **p < 0.001 vs. STZ control; n = 6 animals, Error bars represent mean ± SEM, N values are numbers of pancreas analyzed for each group, all animals killed at 4 weeks after UTMD.
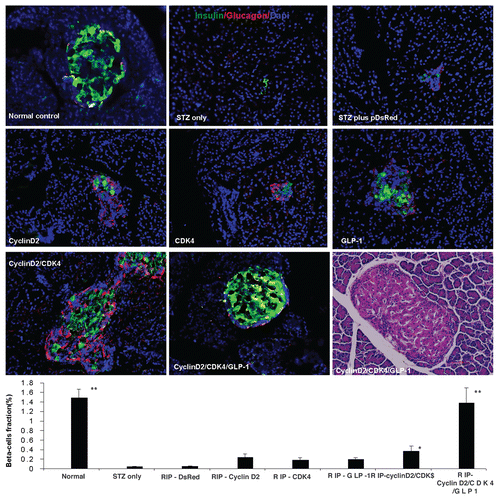
Figure 1 Triple staining for pancreas tissue at magnification of 200x. Anti-insulin (green), Anti-glucagon (red), and anti-nuclear (blue) antibodies were used. Upper left: normal pancreatic islet; Upper middle: STZ treated; Upper right: STZ plus RIP-DsRed; Middle left: RIP-cyclin D2 treated; Middle center: RIP-CDK4 treated; Middle right: RIP-GLP1 treated; Lower left: RIP-cyclin D2/CDK4 treated; Lower center: RIP-cyclin D2/CDK4/GLP1 treated; Lower right: H&E staining for similar slide of RIP-cyclin D2/CDK4/GLP1. Figure at the bottom is the β cell fraction, *p < 0.05; **p < 0.001 vs. STZ control; n = 6 animals, Error bars represent mean ± SEM, N values are numbers of pancreas analyzed for each group, all animals killed at 4 weeks after UTMD.

Figure 2 (A) Plot of fasting blood glucose level; (B) Plot of fasting blood c-peptide level; (C) plot of fasting blood insulin level; (D) glucose tolerance test curve; (E) plot of fasting blood glucose level of time-course experiment; (F) plot of fasting blood insulin level of time-course experiment; (G) plot of fasting blood c-peptide level of time-course experiment; H: rats body weight changes during time-course experiment; *p < 0.05; **p < 0.001 vs. STZ control; n = 6 animals, Error bars represent mean ± SEM, N values are numbers of pancreas analyzed for each group. The glucose tolerance test was performed at 4 weeks after UTMD.
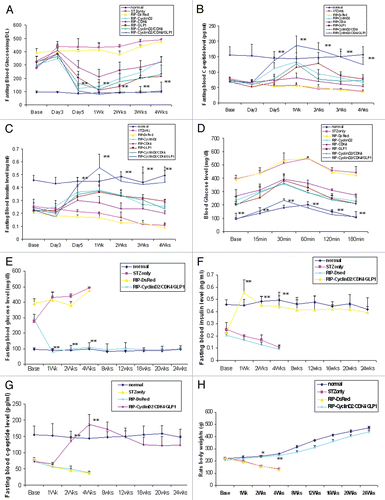
Figure 2 (A) Plot of fasting blood glucose level; (B) Plot of fasting blood c-peptide level; (C) plot of fasting blood insulin level; (D) glucose tolerance test curve; (E) plot of fasting blood glucose level of time-course experiment; (F) plot of fasting blood insulin level of time-course experiment; (G) plot of fasting blood c-peptide level of time-course experiment; H: rats body weight changes during time-course experiment; *p < 0.05; **p < 0.001 vs. STZ control; n = 6 animals, Error bars represent mean ± SEM, N values are numbers of pancreas analyzed for each group. The glucose tolerance test was performed at 4 weeks after UTMD.

Figure 3 Pancreatic transgene expression at one week after cyclin D2/CDK4/GLP-1 gene delivery by UTMD (animals killed at one week after UTMD). Cyclin D2 and CDK4 signal is seen in the cytoplasm and nucleus of insulin- and glucagon-positive cells only; GLP-1 signal seen in the cytoplasm of insulin- and glucagon-positive cells. x400 magnification.
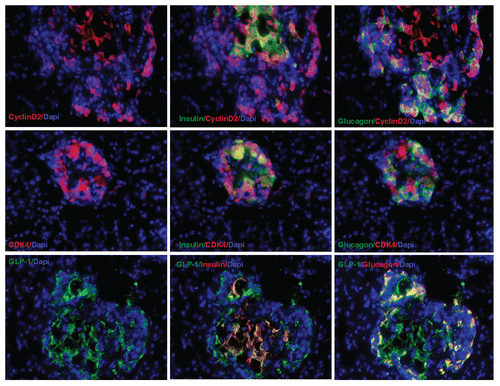
Figure 3 Pancreatic transgene expression at one week after cyclin D2/CDK4/GLP-1 gene delivery by UTMD (animals killed at one week after UTMD). Cyclin D2 and CDK4 signal is seen in the cytoplasm and nucleus of insulin- and glucagon-positive cells only; GLP-1 signal seen in the cytoplasm of insulin- and glucagon-positive cells. x400 magnification.

Figure 4 Transient transgenic expression of human cyclin D2 in rat pancreas. Upper left: rat pancreas of RIP-cyclin D2/CDK4/GLP1 treated group one week after UTMD; Upper right: two weeks after UTMD; Lower left: 4 weeks after UTMD; Lower right: 12 weeks after UTMD; x200 magnification.
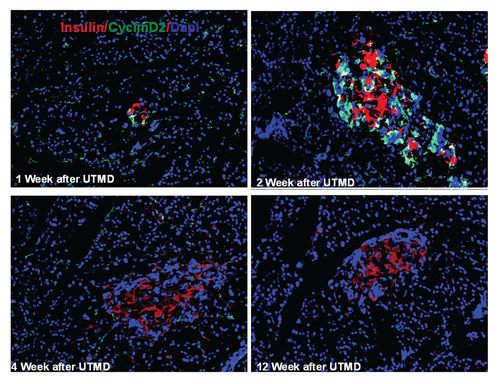
Figure 4 Transient transgenic expression of human cyclin D2 in rat pancreas. Upper left: rat pancreas of RIP-cyclin D2/CDK4/GLP1 treated group one week after UTMD; Upper right: two weeks after UTMD; Lower left: 4 weeks after UTMD; Lower right: 12 weeks after UTMD; x200 magnification.

Figure 5 Immunofluorescent images one week after UTMD with GLP-1/cyclin D2/CDK4 (animals euthanized one week after UTMD), showing co-expression of insulin and amylase (upper left), insulin and glucagon (upper right), glucagon and amylase (lower left), and insulin, amylase and glucagon (lower right). The coexpression of insulin, glucagon and amylase indicates pluripotent pancreatic progenitors within an adult pancreatic islet. x200 magnification. Bottom panel is a plot of percentage of co-expression of insulin, glucagon and amylase in total β cells for the different experimental groups. *p < 0.05 vs. Normal group and STZ group; **p < 0.0001 vs. normal and STZ groups. n = 6 animals, Error bars represent mean ± SEM, N values are numbers of pancreas analyzed for each group.
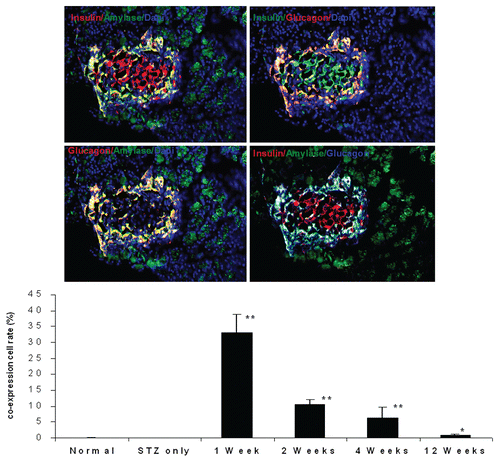
Figure 5 Immunofluorescent images one week after UTMD with GLP-1/cyclin D2/CDK4 (animals euthanized one week after UTMD), showing co-expression of insulin and amylase (upper left), insulin and glucagon (upper right), glucagon and amylase (lower left), and insulin, amylase and glucagon (lower right). The coexpression of insulin, glucagon and amylase indicates pluripotent pancreatic progenitors within an adult pancreatic islet. x200 magnification. Bottom panel is a plot of percentage of co-expression of insulin, glucagon and amylase in total β cells for the different experimental groups. *p < 0.05 vs. Normal group and STZ group; **p < 0.0001 vs. normal and STZ groups. n = 6 animals, Error bars represent mean ± SEM, N values are numbers of pancreas analyzed for each group.
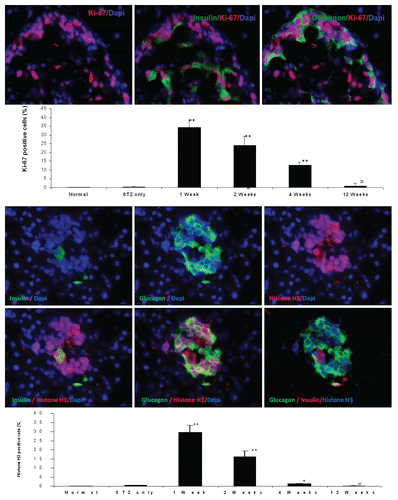
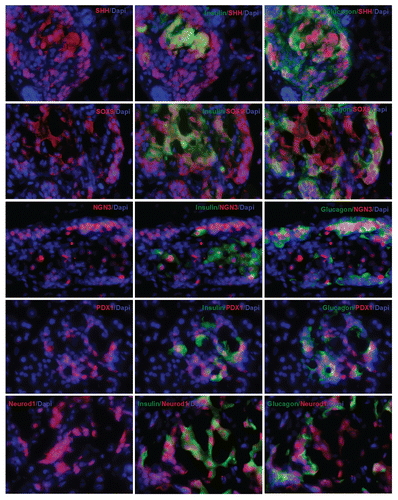
Figure 6 Top panel: Ki-67 staining shown in the nucleus of insulin and glucagon positive cells in the pancreas of diabetic rat one week after UTMD with cyclin D2/CDK4/GLP1 (animals euthanized one week after UTMD), x600 magnification; the graph is a plot of the percentage of Ki-67 positive cells in total β cells for all experimental groups. #p > 0.05 vs. Normal group and STZ group; **p < 0.0001 vs. normal and STZ groups. n = 6 animals, Error bars represent mean ± SEM, N values are numbers of pancreas analyzed for each group. Third panel: Insulin and glucagon positive cells are self-duplicating in the pancreas of diabetic rat one week after UTMD with cyclin D2/CDK4/GLP-1 genes (animals euthanized one week after UTMD). Histone H3 (phospho-Ser10) (a mitosis marker) is clearly seen in the nucleus of insulin and glucagon positive cells, x600 magnification. Bottom panel is a plot of the percentage of Histone H3 positive cells in total β cells for all experimental groups. #p > 0.05 vs. Normal group and STZ group; **p < 0.0001 vs. normal and STZ groups. n = 6 animals, Error bars represent mean ± SEM, N values are numbers of pancreas analyzed for each group.

Figure 6 Top panel: Ki-67 staining shown in the nucleus of insulin and glucagon positive cells in the pancreas of diabetic rat one week after UTMD with cyclin D2/CDK4/GLP1 (animals euthanized one week after UTMD), x600 magnification; the graph is a plot of the percentage of Ki-67 positive cells in total β cells for all experimental groups. #p > 0.05 vs. Normal group and STZ group; **p < 0.0001 vs. normal and STZ groups. n = 6 animals, Error bars represent mean ± SEM, N values are numbers of pancreas analyzed for each group. Third panel: Insulin and glucagon positive cells are self-duplicating in the pancreas of diabetic rat one week after UTMD with cyclin D2/CDK4/GLP-1 genes (animals euthanized one week after UTMD). Histone H3 (phospho-Ser10) (a mitosis marker) is clearly seen in the nucleus of insulin and glucagon positive cells, x600 magnification. Bottom panel is a plot of the percentage of Histone H3 positive cells in total β cells for all experimental groups. #p > 0.05 vs. Normal group and STZ group; **p < 0.0001 vs. normal and STZ groups. n = 6 animals, Error bars represent mean ± SEM, N values are numbers of pancreas analyzed for each group.

Figure 7 Islet transcriptional factors seen in the nucleus of insulin and glucagon positive cells in the pancreas of diabetic rat one week after UTMD with cyclin D2/CDK4/GLP1 (animals euthanized one week after UTMD). x600 magnification.

Figure 7 Islet transcriptional factors seen in the nucleus of insulin and glucagon positive cells in the pancreas of diabetic rat one week after UTMD with cyclin D2/CDK4/GLP1 (animals euthanized one week after UTMD). x600 magnification.

Reprints and Corporate Permissions

Please note: Selecting permissions does not provide access to the full text of the article, please see our help page How do I view content?

To request a reprint or corporate permissions for this article, please click on the relevant link below:

Academic Permissions

Please note: Selecting permissions does not provide access to the full text of the article, please see our help page How do I view content?

Obtain permissions instantly via Rightslink by clicking on the button below:

If you are unable to obtain permissions via Rightslink, please complete and submit this Permissions form. For more information, please visit our Permissions help page.