1,239
Views
28
CrossRef citations to date
0
Altmetric
Report

Cep70 contributes to angiogenesis by modulating microtubule rearrangement and stimulating cell polarization and migration

, , , , &
Pages 1554-1563 | Published online: 15 Apr 2012

Figures & data

Figure 1. Cep70 is required for angiogenesis in mice. (A) Semiclosed angioreactors were implanted subcutaneously into the dorsal flank of athymic nude mice, and after 15 d the angioreactors were removed and photographed (bar indicates 200 μm). Angioreactors filled with basement membrane extract containing heparin/FGF2 were used as the positive control, and angioreactors filled with basement membrane extract not containing heparin/FGF2 were used as the negative control. (B) Immunoblot analysis of Cep70 and actin expression in primary mouse embryonic fibroblasts transfected with control or two different mouse Cep70 siRNAs. (C) Vascular growth in angioreactors filled with basement membrane extract containing heparin/FGF2 and control or mouse Cep70 siRNAs (bar indicates 200 μm). (D) Immunofluorescence microscopy of blood vessels in angioreactors. Frozen sections of the vessel-containing angioreactors were immunostained with anti-CD31 and anti-desmin antibodies to detect endothelial cells (red) and mural cells (green), respectively (bar indicates 20 μm). (E) Experiments were performed as in panel D, and vascular density in angioreactors was measured by counting vessels with a layer of endothelial cells surrounded by mural cells (**p < 0.01 vs. control siRNA). (F) Hemoglobin content of blood vessels in angioreactors (*p < 0.05 vs. control siRNA). (G) Cell pellets recovered from the angioreactors were stained with fluorescein-lectin, and the level of endothelial cells was reflected by the fluorescence intensity (*p < 0.05 vs. control siRNA).
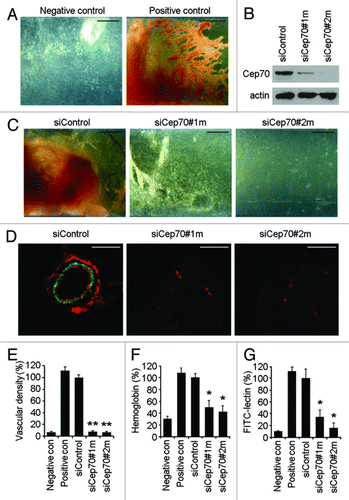
Figure 1. Cep70 is required for angiogenesis in mice. (A) Semiclosed angioreactors were implanted subcutaneously into the dorsal flank of athymic nude mice, and after 15 d the angioreactors were removed and photographed (bar indicates 200 μm). Angioreactors filled with basement membrane extract containing heparin/FGF2 were used as the positive control, and angioreactors filled with basement membrane extract not containing heparin/FGF2 were used as the negative control. (B) Immunoblot analysis of Cep70 and actin expression in primary mouse embryonic fibroblasts transfected with control or two different mouse Cep70 siRNAs. (C) Vascular growth in angioreactors filled with basement membrane extract containing heparin/FGF2 and control or mouse Cep70 siRNAs (bar indicates 200 μm). (D) Immunofluorescence microscopy of blood vessels in angioreactors. Frozen sections of the vessel-containing angioreactors were immunostained with anti-CD31 and anti-desmin antibodies to detect endothelial cells (red) and mural cells (green), respectively (bar indicates 20 μm). (E) Experiments were performed as in panel D, and vascular density in angioreactors was measured by counting vessels with a layer of endothelial cells surrounded by mural cells (**p < 0.01 vs. control siRNA). (F) Hemoglobin content of blood vessels in angioreactors (*p < 0.05 vs. control siRNA). (G) Cell pellets recovered from the angioreactors were stained with fluorescein-lectin, and the level of endothelial cells was reflected by the fluorescence intensity (*p < 0.05 vs. control siRNA).

Figure 2. Depletion of Cep70 diminishes angiogenesis in vitro. (A) Immunoblot analysis of Cep70 and actin expression in HUVECs transfected with control or two different human Cep70 siRNAs. (B) HUVECs transfected with control or Cep70 siRNAs were plated onto matrigel, and photographs were taken 6 and 18 h later (bar indicates 100 μm). (C) Experiments were performed as in panel B, and the cumulative tube length was calculated (**p < 0.01 vs. control). (D) Experiments were performed as in panel B, and the number of tube nodes was examined (**p < 0.01 vs. control). (E) Capillary-like sprouting from spheroids generated from HUVECs transfected with control or Cep70 siRNAs (bar indicates 50 μm). (F) Experiments were performed as in panel E, and the cumulative sprout length was calculated (**p < 0.01 vs. control). (G) Experiments were performed as in panel E, and the number of sprouts was examined (**p < 0.01 vs. control).
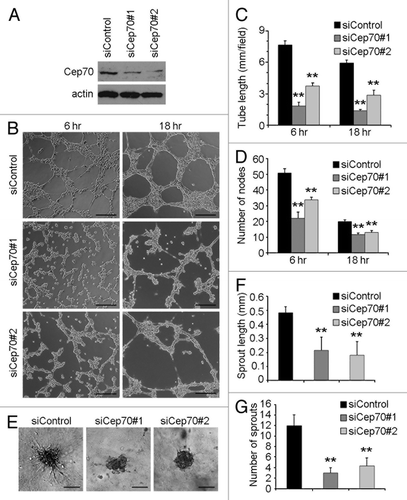
Figure 2. Depletion of Cep70 diminishes angiogenesis in vitro. (A) Immunoblot analysis of Cep70 and actin expression in HUVECs transfected with control or two different human Cep70 siRNAs. (B) HUVECs transfected with control or Cep70 siRNAs were plated onto matrigel, and photographs were taken 6 and 18 h later (bar indicates 100 μm). (C) Experiments were performed as in panel B, and the cumulative tube length was calculated (**p < 0.01 vs. control). (D) Experiments were performed as in panel B, and the number of tube nodes was examined (**p < 0.01 vs. control). (E) Capillary-like sprouting from spheroids generated from HUVECs transfected with control or Cep70 siRNAs (bar indicates 50 μm). (F) Experiments were performed as in panel E, and the cumulative sprout length was calculated (**p < 0.01 vs. control). (G) Experiments were performed as in panel E, and the number of sprouts was examined (**p < 0.01 vs. control).

Figure 3. Cep70 is critical for vascular endothelial cell migration. (A) HUVECs transfected with control or Cep70 siRNAs were scratched, and wound margins were photographed 0 and 12 h later (bar indicates 100 μm). (B) Experiments were performed as in panel A, and the extent of wound closure was quantified by measuring the wound area compared with the initial wound area (**p < 0.01 vs. control). (C) HUVECs transfected with control or Cep70 siRNAs were plated on the inside of the transwell insert, and after 18 h, cells migrated to the underside of the insert were stained with crystal violet solution (bar indicates 50 μm). (D) Experiments were performed as in panel C, and the number of migrated cells was examined. (E) Immunoblot analysis of Cep70 and actin expression in HUVECs transfected with pSIREN-RetroQ or pSIREN-RetroQ-Cep70 plasmids. (F) HUVECs were transfected with pEGFPC1 and pSIREN-RetroQ or pSIREN-RetroQ-Cep70 plasmids, and the fluorescence of GFP at the leading edge of cells was recorded at 20 sec intervals. Rectangular regions were selected as indicated to analyze membrane ruffle dynamics (bar indicates 10 μm). (G) Experiments were performed as in panel F, and membrane ruffle dynamics were presented as 3-dimensional surface plots.
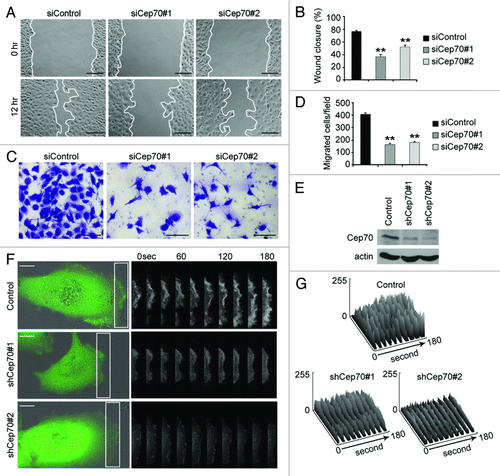
Figure 3. Cep70 is critical for vascular endothelial cell migration. (A) HUVECs transfected with control or Cep70 siRNAs were scratched, and wound margins were photographed 0 and 12 h later (bar indicates 100 μm). (B) Experiments were performed as in panel A, and the extent of wound closure was quantified by measuring the wound area compared with the initial wound area (**p < 0.01 vs. control). (C) HUVECs transfected with control or Cep70 siRNAs were plated on the inside of the transwell insert, and after 18 h, cells migrated to the underside of the insert were stained with crystal violet solution (bar indicates 50 μm). (D) Experiments were performed as in panel C, and the number of migrated cells was examined. (E) Immunoblot analysis of Cep70 and actin expression in HUVECs transfected with pSIREN-RetroQ or pSIREN-RetroQ-Cep70 plasmids. (F) HUVECs were transfected with pEGFPC1 and pSIREN-RetroQ or pSIREN-RetroQ-Cep70 plasmids, and the fluorescence of GFP at the leading edge of cells was recorded at 20 sec intervals. Rectangular regions were selected as indicated to analyze membrane ruffle dynamics (bar indicates 10 μm). (G) Experiments were performed as in panel F, and membrane ruffle dynamics were presented as 3-dimensional surface plots.

Figure 4. Cep70 mediates the polarization of vascular endothelial cells. (A) HUVECs were transfected with pEGFPC1 and pSIREN-RetroQ or pSIREN-RetroQ-Cep70 plasmids, and the percentage of cells with membrane ruffles at the leading edge was examined. (B) Experiments were performed as in panel A, and the percentages of cells with 1–2, 3–4, or > 4 membrane ruffles at the leading edge were examined. (C) HUVECs transfected with control or Cep70 siRNAs were scratched, and cells were fixed 3 h later and stained with anti-α-tubulin antibody, anti-pericentrin antibody, and DAPI to visualize microtubules (green), centrosomes (red), and nuclei (blue), respectively. Broken white lines indicate the wound direction (bar indicates 10 μm). (D) Experiments were performed as in panel C, and the percentage of polarized cells at the wound margin was quantified (**p < 0.01 vs. control). (E) Experiments were performed as in panel C, and the intensity of leading-edge microtubules was quantified (**p < 0.01 vs. control). (F) Experiments were performed as in panel C, and the position of the nucleus and the centrosome relative to the cell centroid was quantified. (Bottom panel) A model shows the position of the nucleus and the centrosome in cells transfected with control or Cep70 siRNAs.
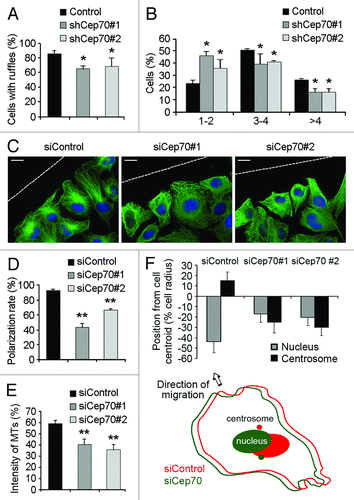
Figure 4. Cep70 mediates the polarization of vascular endothelial cells. (A) HUVECs were transfected with pEGFPC1 and pSIREN-RetroQ or pSIREN-RetroQ-Cep70 plasmids, and the percentage of cells with membrane ruffles at the leading edge was examined. (B) Experiments were performed as in panel A, and the percentages of cells with 1–2, 3–4, or > 4 membrane ruffles at the leading edge were examined. (C) HUVECs transfected with control or Cep70 siRNAs were scratched, and cells were fixed 3 h later and stained with anti-α-tubulin antibody, anti-pericentrin antibody, and DAPI to visualize microtubules (green), centrosomes (red), and nuclei (blue), respectively. Broken white lines indicate the wound direction (bar indicates 10 μm). (D) Experiments were performed as in panel C, and the percentage of polarized cells at the wound margin was quantified (**p < 0.01 vs. control). (E) Experiments were performed as in panel C, and the intensity of leading-edge microtubules was quantified (**p < 0.01 vs. control). (F) Experiments were performed as in panel C, and the position of the nucleus and the centrosome relative to the cell centroid was quantified. (Bottom panel) A model shows the position of the nucleus and the centrosome in cells transfected with control or Cep70 siRNAs.

Figure 5. Cep70 regulates microtubule rearrangement in migrating cells. (A-B) HUVECs transfected with control or Cep70 siRNAs were scratched, and 2 h later cells were treated with nocodazole to depolymerize microtubules. Nocodazole was then washed out and microtubule regrowth was examined 1 min (A) or 5 min (B) later, by immunofluorescent staining with anti-α-tubulin antibody and DAPI (bar indicates 10 μm). (C-D) Experiments were performed as in panels A and B, respectively, and the intensity of microtubules was quantified (*p < 0.05 vs. control; **p < 0.01 vs. control). (E) Experiments were performed as in panel B, and the percentage of cells with organized microtubules was examined (**p < 0.01 vs. control).
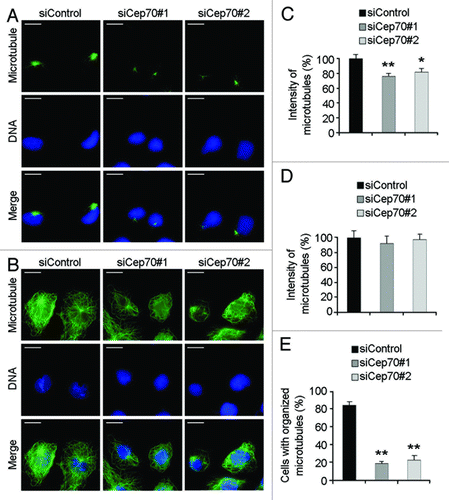
Figure 5. Cep70 regulates microtubule rearrangement in migrating cells. (A-B) HUVECs transfected with control or Cep70 siRNAs were scratched, and 2 h later cells were treated with nocodazole to depolymerize microtubules. Nocodazole was then washed out and microtubule regrowth was examined 1 min (A) or 5 min (B) later, by immunofluorescent staining with anti-α-tubulin antibody and DAPI (bar indicates 10 μm). (C-D) Experiments were performed as in panels A and B, respectively, and the intensity of microtubules was quantified (*p < 0.05 vs. control; **p < 0.01 vs. control). (E) Experiments were performed as in panel B, and the percentage of cells with organized microtubules was examined (**p < 0.01 vs. control).

Figure 6. Cdc42 and Rac1 activation contribute to the role of Cep70 in angiogenesis. (A) HUVECs transfected with control or Cep70 siRNAs were scratched, and cells were lysed 3 h later. The levels of activated (GTP-bound) Cdc42 and Rac1 were examined by immunoblot analysis of the GST-PBD pulldown preparation with anti-Cdc42 and anti-Rac1 antibodies. The level of activated (GTP-bound) RhoA was examined by immunoblot analysis of the GST-RBD pulldown preparation with anti-RhoA antibody. The levels of total Cdc42, Rac1, RhoA and actin were examined by immunoblot analysis of cell lysates. (B) Experiments were performed as in panel A, and the relative activities of Cdc42, Rac1 and RhoA were measured by densitometric analysis of the blots (*p < 0.05 vs. control; **p < 0.01 vs. control). (C) HUVECs transfected with Cep70 siRNA and pEGFPC1-Cdc42, pEGFPC1-Rac1, pEGFPC1-RhoA or pEGFPC1 vector were plated onto matrigel, and photographs were taken 6 and 18 h later (bar indicates 100 μm). (D) Experiments were performed as in panel C, and the cumulative tube length was calculated (**p < 0.01 vs. control).
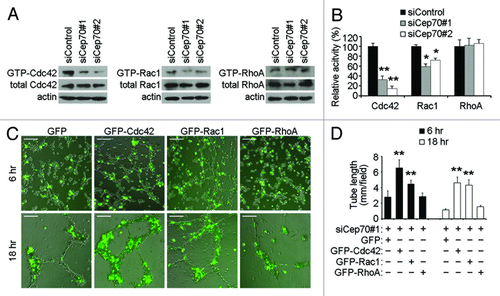
Figure 6. Cdc42 and Rac1 activation contribute to the role of Cep70 in angiogenesis. (A) HUVECs transfected with control or Cep70 siRNAs were scratched, and cells were lysed 3 h later. The levels of activated (GTP-bound) Cdc42 and Rac1 were examined by immunoblot analysis of the GST-PBD pulldown preparation with anti-Cdc42 and anti-Rac1 antibodies. The level of activated (GTP-bound) RhoA was examined by immunoblot analysis of the GST-RBD pulldown preparation with anti-RhoA antibody. The levels of total Cdc42, Rac1, RhoA and actin were examined by immunoblot analysis of cell lysates. (B) Experiments were performed as in panel A, and the relative activities of Cdc42, Rac1 and RhoA were measured by densitometric analysis of the blots (*p < 0.05 vs. control; **p < 0.01 vs. control). (C) HUVECs transfected with Cep70 siRNA and pEGFPC1-Cdc42, pEGFPC1-Rac1, pEGFPC1-RhoA or pEGFPC1 vector were plated onto matrigel, and photographs were taken 6 and 18 h later (bar indicates 100 μm). (D) Experiments were performed as in panel C, and the cumulative tube length was calculated (**p < 0.01 vs. control).

Reprints and Corporate Permissions

Please note: Selecting permissions does not provide access to the full text of the article, please see our help page How do I view content?

To request a reprint or corporate permissions for this article, please click on the relevant link below:

Academic Permissions

Please note: Selecting permissions does not provide access to the full text of the article, please see our help page How do I view content?

Obtain permissions instantly via Rightslink by clicking on the button below:

If you are unable to obtain permissions via Rightslink, please complete and submit this Permissions form. For more information, please visit our Permissions help page.