1,882
Views
32
CrossRef citations to date
0
Altmetric
Report

Expression of the 49 human ATP binding cassette (ABC) genes in pluripotent embryonic stem cells and in early- and late-stage multipotent mesenchymal stem cells

Possible role of ABC plasma membrane transporters in maintaining human stem cell pluripotency

, , , , &
Pages 1611-1620 | Published online: 15 Apr 2012

Figures & data

Figure 1. Heat maps showing the expression levels of the 49 human ABC genes in hESCs, hES-MSCs and hMSCs. (A) Expression of all 49 human ABC genes in 14 samples of three stem cell types (hESCs, hES-MSCs and hMSCs). The 49 ABC genes are shown on the x-axis, ordered from high to low expression in each sub-family (ABCA to ABCG), according to the mean NCt values from the six hESC samples. The 14 samples are ordered on the y-axis with biological replicates (“a” and “b”). The color code ranges from high (NCt = 20, light green) through medium (black), to low but significant (NCt = 34.9, red) or undetectable (NCt ≥ 35, orange) gene expression. For each ABC, the structure, subcellular localization, function and substrates or association with human diseasesCitation3-Citation5,Citation12,Citation33,Citation34 are represented by symbols, as detailed in the figure. (B) Overviews of mean ABC gene expression in the three stem cell types. ABC genes are ordered from high to low expression levels according to mean NCt values. Gene expression levels are sub-divided into categories as follows: high or medium (NCt < 29), low but significant (29 NCt < 35), and undetectable (NCt ≥ 35). We can observe that the ABCs with high gene expression are those representing intracellular basal functions. Virtually all ABCs with low but significant expression are plasma membrane transporters whose expression levels vary between the three stem cell populations. Seven of these genes (marked with asterisks) are expressed exclusively in pluripotent or primitive multipotent stem cells.
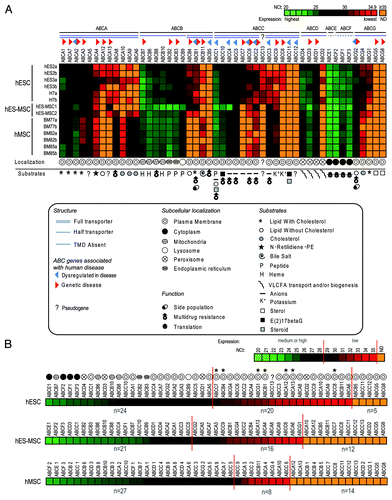
Figure 1. Heat maps showing the expression levels of the 49 human ABC genes in hESCs, hES-MSCs and hMSCs. (A) Expression of all 49 human ABC genes in 14 samples of three stem cell types (hESCs, hES-MSCs and hMSCs). The 49 ABC genes are shown on the x-axis, ordered from high to low expression in each sub-family (ABCA to ABCG), according to the mean NCt values from the six hESC samples. The 14 samples are ordered on the y-axis with biological replicates (“a” and “b”). The color code ranges from high (NCt = 20, light green) through medium (black), to low but significant (NCt = 34.9, red) or undetectable (NCt ≥ 35, orange) gene expression. For each ABC, the structure, subcellular localization, function and substrates or association with human diseasesCitation3-Citation5,Citation12,Citation33,Citation34 are represented by symbols, as detailed in the figure. (B) Overviews of mean ABC gene expression in the three stem cell types. ABC genes are ordered from high to low expression levels according to mean NCt values. Gene expression levels are sub-divided into categories as follows: high or medium (NCt < 29), low but significant (29 ≤ NCt < 35), and undetectable (NCt ≥ 35). We can observe that the ABCs with high gene expression are those representing intracellular basal functions. Virtually all ABCs with low but significant expression are plasma membrane transporters whose expression levels vary between the three stem cell populations. Seven of these genes (marked with asterisks) are expressed exclusively in pluripotent or primitive multipotent stem cells.

Figure 2. Expression of the 49 human ABC genes in hESCs. ABC genes are classified into subgroups as follows: (A) ABCA; (B) ABCB; (C) ABCC; (D) ABC-D, -E, -F and -G. Radial plots are sub-divided in areas as follows: high (NCt < 29, white), low but significant (29 ≤ NCt < 35, light-gray) and undetectable (NCt ≥ 35, gray) gene expression. Arrows and their directions indicate significant gene expression variations during development of hESCs to hES-MSCs and/or hMSCs. Information relating to structure, disease associations, subcellular localizations (bold) and substrates and specific functions (italics) derived from referencesCitation3-Citation5,Citation12,Citation33,Citation34 are detailed in the figure.
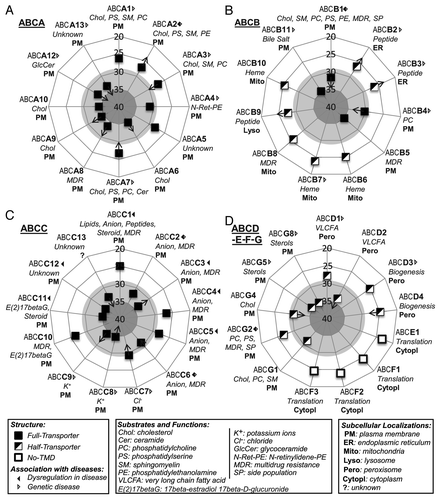
Figure 2. Expression of the 49 human ABC genes in hESCs. ABC genes are classified into subgroups as follows: (A) ABCA; (B) ABCB; (C) ABCC; (D) ABC-D, -E, -F and -G. Radial plots are sub-divided in areas as follows: high (NCt < 29, white), low but significant (29 ≤ NCt < 35, light-gray) and undetectable (NCt ≥ 35, gray) gene expression. Arrows and their directions indicate significant gene expression variations during development of hESCs to hES-MSCs and/or hMSCs. Information relating to structure, disease associations, subcellular localizations (bold) and substrates and specific functions (italics) derived from referencesCitation3-Citation5,Citation12,Citation33,Citation34 are detailed in the figure.

Table 1. ABC genes displaying similar expression in hESCs, hES-MSCs and hMSCs

Figure 3. Twenty-three ABC genes are significantly up- or downregulated during the development of hESCs toward hES-MSCs and hMSCs. Compared with the hESC reference group, relative quantification and standard deviation values for hES-MSCs (white) and hMSCs (hatched) were calculated as previously describedCitation24,Citation76 with the five reference genes indicated in Materials and Methods. Statistical significance (p < 0.05) is indicated by asterisks. For hESCs, mean NCt (± SD) values are shown below the x-axis. ABC genes are categorized into four sets, based on subcellular localizations and substrates: (A) intracellular transporters; (B) plasma membrane lipid transporters; (C) plasma membrane ion transporters; (D) ABCs with unknown function or substrate. Bold downward-pointing arrows () indicate the abolition of gene expression (defined as NCt ≥ 35) in hES-MSCs or hMSCs. Abbreviations for substrates and specific functions (italics), and subcellular localizations (bold), are as described in .
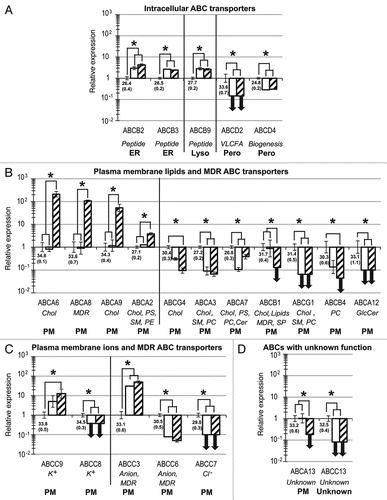
Figure 3. Twenty-three ABC genes are significantly up- or downregulated during the development of hESCs toward hES-MSCs and hMSCs. Compared with the hESC reference group, relative quantification and standard deviation values for hES-MSCs (white) and hMSCs (hatched) were calculated as previously describedCitation24,Citation76 with the five reference genes indicated in Materials and Methods. Statistical significance (p < 0.05) is indicated by asterisks. For hESCs, mean NCt (± SD) values are shown below the x-axis. ABC genes are categorized into four sets, based on subcellular localizations and substrates: (A) intracellular transporters; (B) plasma membrane lipid transporters; (C) plasma membrane ion transporters; (D) ABCs with unknown function or substrate. Bold downward-pointing arrows (↓) indicate the abolition of gene expression (defined as NCt ≥ 35) in hES-MSCs or hMSCs. Abbreviations for substrates and specific functions (italics), and subcellular localizations (bold), are as described in Figure 2.

Figure 3E. (E) A typical Hematopoietic Stem Cell (HSC) niche. Shown is a small HSC with a high nucleo-cytoplasmic ratio and prominent nucleoli, embedded in an adipocyte full of lipid droplets. Strong plasma membrane interdigitation is observed between the adipocyte and the HSC, suggesting possible lipid transport.
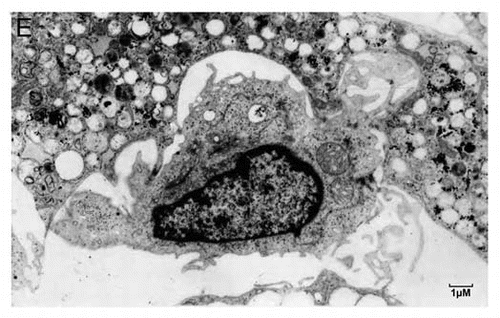
Figure 3E. (E) A typical Hematopoietic Stem Cell (HSC) niche. Shown is a small HSC with a high nucleo-cytoplasmic ratio and prominent nucleoli, embedded in an adipocyte full of lipid droplets. Strong plasma membrane interdigitation is observed between the adipocyte and the HSC, suggesting possible lipid transport.
Supplemental material

Additional material

Download Zip (869.9 KB)

Reprints and Corporate Permissions

Please note: Selecting permissions does not provide access to the full text of the article, please see our help page How do I view content?

To request a reprint or corporate permissions for this article, please click on the relevant link below:

Academic Permissions

Please note: Selecting permissions does not provide access to the full text of the article, please see our help page How do I view content?

Obtain permissions instantly via Rightslink by clicking on the button below:

If you are unable to obtain permissions via Rightslink, please complete and submit this Permissions form. For more information, please visit our Permissions help page.