1,942
Views
56
CrossRef citations to date
0
Altmetric
Report

Chalcone-based small-molecule inhibitors attenuate malignant phenotype via targeting deubiquitinating enzymes

&
Pages 1804-1817 | Received 31 Jan 2012, Accepted 27 Mar 2012, Published online: 01 May 2012

Figures & data

Figure 1. Chalcone-derivatives suppress cell viability in breast, ovarian and cervical cancers. Cells were treated with indicated doses of chalcone-derivatives for 48 h and cell viability was measured using WST-1 reagent as described in Material and Methods. Sigmoidal dose-response curves were plotted using GraphPad Prism 5.04.
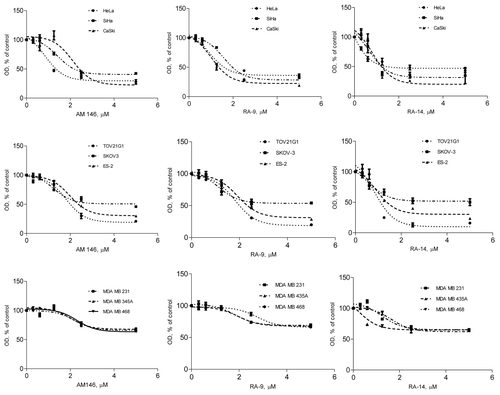
Figure 1. Chalcone-derivatives suppress cell viability in breast, ovarian and cervical cancers. Cells were treated with indicated doses of chalcone-derivatives for 48 h and cell viability was measured using WST-1 reagent as described in Material and Methods. Sigmoidal dose-response curves were plotted using GraphPad Prism 5.04.

Table 1. IC50 values for chalcone-based derivatives.

Figure 2. AM146, RA-9 and RA-14 abrogate cell cycle progression and colony formation and trigger apoptosis. (A) Cell viability. HeLa cells were treated with 10 nM bortezomib (PS341), 5 µM AM146, 5 µM RA-9, 5 µM RA-14 or 5 µM RA-4. Cell viability was measured at indicated periods using WST-1 reagent as described in Material and Methods. Columns represent O.D. values as % of DMSO control ± standard error. *Indicates p ≤ 0.05. (B) Anchorage-dependent colony formation. 1x10³ cells were plated in 6-well clusters and grown with or without 0.3 µM of AM146, RA-9 or RA-14. After 10 d, cells were fixed and stained. (C and D) FACS analysis. HeLa cells were plated at 2x10⁵ in 6-well clusters. Twelve hours later, cells were treated with 10 nM PS341, 10 µM AM146, 10 µM RA-9 or 10 µM RA-14 for 24 h. Cells were then collected, stained with propidium iodide and analyzed for DNA content. (C) Progression through S or G2/M cell cycle checkpoints. Results are plotted as % of cells in S/G2/M ± standard error. *Indicates p ≤ 0.05. (D) Apoptosis frequency. Cells with hypo-diploid DNA content (sub-G1) were measured by FACS analysis. Columns reflect % of cells with hypo-diploid DNA content ± standard error. *Indicates p ≤ 0.05.
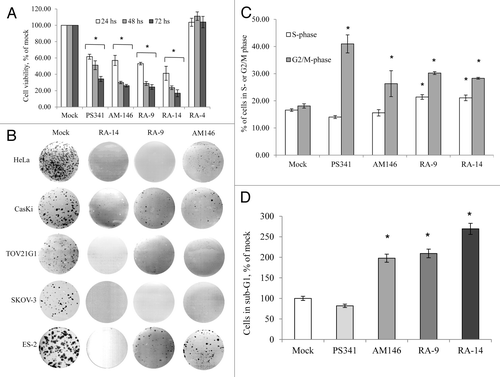
Figure 2. AM146, RA-9 and RA-14 abrogate cell cycle progression and colony formation and trigger apoptosis. (A) Cell viability. HeLa cells were treated with 10 nM bortezomib (PS341), 5 µM AM146, 5 µM RA-9, 5 µM RA-14 or 5 µM RA-4. Cell viability was measured at indicated periods using WST-1 reagent as described in Material and Methods. Columns represent O.D. values as % of DMSO control ± standard error. *Indicates p ≤ 0.05. (B) Anchorage-dependent colony formation. 1x10³ cells were plated in 6-well clusters and grown with or without 0.3 µM of AM146, RA-9 or RA-14. After 10 d, cells were fixed and stained. (C and D) FACS analysis. HeLa cells were plated at 2x10⁵ in 6-well clusters. Twelve hours later, cells were treated with 10 nM PS341, 10 µM AM146, 10 µM RA-9 or 10 µM RA-14 for 24 h. Cells were then collected, stained with propidium iodide and analyzed for DNA content. (C) Progression through S or G2/M cell cycle checkpoints. Results are plotted as % of cells in S/G2/M ± standard error. *Indicates p ≤ 0.05. (D) Apoptosis frequency. Cells with hypo-diploid DNA content (sub-G1) were measured by FACS analysis. Columns reflect % of cells with hypo-diploid DNA content ± standard error. *Indicates p ≤ 0.05.

Figure 3. Chalcone-derivatives induce accumulation of poly-ubiqutinated proteins in breast, ovarian and cervical cancer cell lines. Western blot analysis. Samples were probed with anti-ubiquitin antibody. Actin is shown as a loading control. (A) HeLa (top panel) or TOV21G1 (bottom panel) cells were treated with 10 nM bortezomib (PS341), 5 µM AM146, 5 µM RA-9, 5 µM RA-14 or 5 µM RA-4 for the indicated time periods. Protein samples were resolved with: top panel, 12% SDS-gel; bottom panel, 4–20% gradient SDS-gel (B). Breast cancer MDA MB 231 and MDA MB 468 cells and melanoma cancer MDA MB 435 cells (historically misidentified as breast cancer) were treated with 10 nM PS341 or indicated concentrations of AM146 for 6 h. Samples were resolved using 4–20% gradient SDS-gel. (C) HeLa cells were treated as in (A) and samples were resolved as in (B) to visualize ubiquitin monomers and unanchored ubiquitin chains (Ubq 2–6). (D) Indicated ovarian, breast and cervical cancer cells were treated with 5 µM RA-9 for 6 h and samples were resolved as in (B).
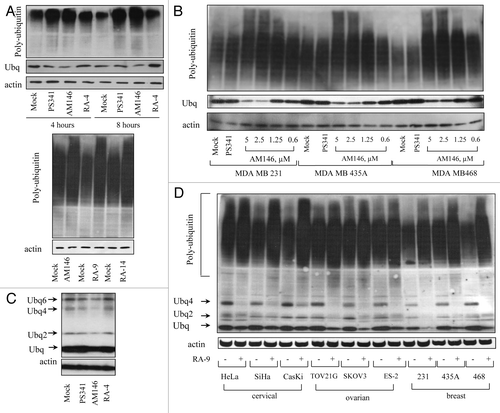
Figure 3. Chalcone-derivatives induce accumulation of poly-ubiqutinated proteins in breast, ovarian and cervical cancer cell lines. Western blot analysis. Samples were probed with anti-ubiquitin antibody. Actin is shown as a loading control. (A) HeLa (top panel) or TOV21G1 (bottom panel) cells were treated with 10 nM bortezomib (PS341), 5 µM AM146, 5 µM RA-9, 5 µM RA-14 or 5 µM RA-4 for the indicated time periods. Protein samples were resolved with: top panel, 12% SDS-gel; bottom panel, 4–20% gradient SDS-gel (B). Breast cancer MDA MB 231 and MDA MB 468 cells and melanoma cancer MDA MB 435 cells (historically misidentified as breast cancer) were treated with 10 nM PS341 or indicated concentrations of AM146 for 6 h. Samples were resolved using 4–20% gradient SDS-gel. (C) HeLa cells were treated as in (A) and samples were resolved as in (B) to visualize ubiquitin monomers and unanchored ubiquitin chains (Ubq 2–6). (D) Indicated ovarian, breast and cervical cancer cells were treated with 5 µM RA-9 for 6 h and samples were resolved as in (B).

Figure 4. AM146, RA-9 and RA-14 do not inhibit 20S proteasome activity but differentially modulate 26S proteasome activity in living cells. (A) 20S purified human proteasome were incubated with or without compound at indicated concentrations for one hour. Proteasome-Glo assay was performed and three activities of proteasome, chymotrypsin-like, trypsin-like and caspase-like, were measured as described in Material and Methods. Background luminescence values (DMSO + cell culture medium) were subtracted, and data plotted as relative luminescence unit (RLU). PS341 is shown as a positive control. Averages are based on the mean number for two independent experiments ± standard error. All experiments were done in triplicate. (B), (C) Stabilization of ubiquitin-luciferase bioluminescent reporter (Ub-FL). (B) Transiently transfected firefly luciferase (CMV-Luc) and Ub-FL HeLa cells were either mock-treated or treated with proteasome inhibitors bortezomib (PS341) or MG-132, non-cell-permeable DUBS inhibitor ubiquitin aldehyde (Ubal), or inhibitors AM146, or RA-9 or KVI-14 at the indicated concentrations for 8 h. Luciferase activity in cell lysates was quantified, background values were subtracted (relative luminescence units, RLU), data expressed as % of mock and the ratio of stabilized Ub-FL to baseline levels of CMV-Luc is shown on graph. Error bars are standard errors (SE) for three independent experiments. *Indicates p ≤ 0.05. (C) Transiently transfected CMV-Luc and Ub-FL HeLa cells were either mock-treated or treated with bortezomib, AM146, or a combination at the indicated concentrations for 8 h. Luciferase activity on cell lysate was quantified in relative luminescence units (RLU) and expressed as percent of control. Error bars are standard errors (SE) for three independent experiments. *Indicates p ≤ 0.05.
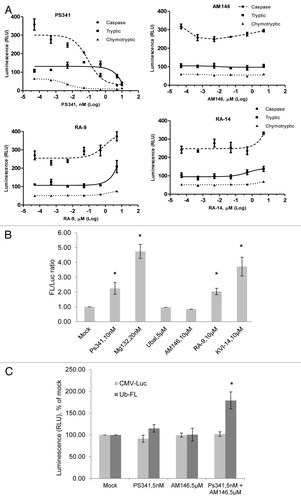
Figure 4. AM146, RA-9 and RA-14 do not inhibit 20S proteasome activity but differentially modulate 26S proteasome activity in living cells. (A) 20S purified human proteasome were incubated with or without compound at indicated concentrations for one hour. Proteasome-Glo assay was performed and three activities of proteasome, chymotrypsin-like, trypsin-like and caspase-like, were measured as described in Material and Methods. Background luminescence values (DMSO + cell culture medium) were subtracted, and data plotted as relative luminescence unit (RLU). PS341 is shown as a positive control. Averages are based on the mean number for two independent experiments ± standard error. All experiments were done in triplicate. (B), (C) Stabilization of ubiquitin-luciferase bioluminescent reporter (Ub-FL). (B) Transiently transfected firefly luciferase (CMV-Luc) and Ub-FL HeLa cells were either mock-treated or treated with proteasome inhibitors bortezomib (PS341) or MG-132, non-cell-permeable DUBS inhibitor ubiquitin aldehyde (Ubal), or inhibitors AM146, or RA-9 or KVI-14 at the indicated concentrations for 8 h. Luciferase activity in cell lysates was quantified, background values were subtracted (relative luminescence units, RLU), data expressed as % of mock and the ratio of stabilized Ub-FL to baseline levels of CMV-Luc is shown on graph. Error bars are standard errors (SE) for three independent experiments. *Indicates p ≤ 0.05. (C) Transiently transfected CMV-Luc and Ub-FL HeLa cells were either mock-treated or treated with bortezomib, AM146, or a combination at the indicated concentrations for 8 h. Luciferase activity on cell lysate was quantified in relative luminescence units (RLU) and expressed as percent of control. Error bars are standard errors (SE) for three independent experiments. *Indicates p ≤ 0.05.

Figure 5. Chalcone-derivatives, AM146, RA-9 and RA-15, suppress activity of deubiqutinating enzymes (DUB). (A) Cellular DUB activity. 0.6 x 10⁵ HeLa cells were incubated with 25 nM PS341, 10 µM AM146, 10 µM RA-9, 10 µM RA-14 or 10 µM DBA for 24 h. DUB activity in whole-cell extracts was performed as described in Material and Methods using DUB-Glo™ Protease Assay reagent. Background luminescence values (DMSO + cell culture medium) were subtracted, and data plotted as relative luminescence unit (RLU) and are based on two independent experiments ± standard error. *Indicates p ≤ 0.05. All experiments were done in triplicate. (B) Activity of purified human enzymes in vitro. The activity of 500 nM UCH-L1, 50 nM UCH-L3, 200 nM BAP1, 100 nM USP7 or 50 nM USP8 was measured with/without 10 µM AM146, 10 µM RA-9 or 10 µM RA-14 using DUB-Glo™ Protease Assay reagent as described in Material and Methods. Background luminescence values (DMSO + enzyme buffer) were subtracted, and data plotted as % of untreated control (DMSO+ enzyme) ± standard error. * indicates p ≤ 0.05 Two independent experiments were done in duplicate. (C) Activity of 50 nM UCH-L3 treated with indicated concentrations of AM-146, RA-9 and RA-14 was measured as in (B). Known DUB-inhibitors, ubiquitin aldehyde (ubal) and dibenzylideneacetone (DBA), were used as a positive control. Background luminescence values (DMSO + enzyme buffer) were subtracted, and data plotted as % of untreated control (DMSO+ enzyme) ± standard error. *Indicates p ≤ 0.05.
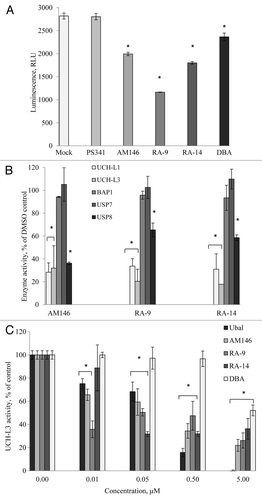
Figure 5. Chalcone-derivatives, AM146, RA-9 and RA-15, suppress activity of deubiqutinating enzymes (DUB). (A) Cellular DUB activity. 0.6 x 10⁵ HeLa cells were incubated with 25 nM PS341, 10 µM AM146, 10 µM RA-9, 10 µM RA-14 or 10 µM DBA for 24 h. DUB activity in whole-cell extracts was performed as described in Material and Methods using DUB-Glo™ Protease Assay reagent. Background luminescence values (DMSO + cell culture medium) were subtracted, and data plotted as relative luminescence unit (RLU) and are based on two independent experiments ± standard error. *Indicates p ≤ 0.05. All experiments were done in triplicate. (B) Activity of purified human enzymes in vitro. The activity of 500 nM UCH-L1, 50 nM UCH-L3, 200 nM BAP1, 100 nM USP7 or 50 nM USP8 was measured with/without 10 µM AM146, 10 µM RA-9 or 10 µM RA-14 using DUB-Glo™ Protease Assay reagent as described in Material and Methods. Background luminescence values (DMSO + enzyme buffer) were subtracted, and data plotted as % of untreated control (DMSO+ enzyme) ± standard error. * indicates p ≤ 0.05 Two independent experiments were done in duplicate. (C) Activity of 50 nM UCH-L3 treated with indicated concentrations of AM-146, RA-9 and RA-14 was measured as in (B). Known DUB-inhibitors, ubiquitin aldehyde (ubal) and dibenzylideneacetone (DBA), were used as a positive control. Background luminescence values (DMSO + enzyme buffer) were subtracted, and data plotted as % of untreated control (DMSO+ enzyme) ± standard error. *Indicates p ≤ 0.05.

Figure 6. Chalcone-derivatives modulate expression of cell cycle promoters/tumor suppressors via altering USP activity. (A) Activity of purified human USP5 in vitro. The activity 100 nM USP5 was measured with/without 10 µM AM146, 10 µM RA-9 or 10 µM RA-14 using DUB-Glo™ Protease Assay reagent as described in Material and Methods. Treatment with 0.5 nM ubiquitin aldehyde (Ubal) was used as a positive control. Data were analyzed and plotted as in . (B) western blot analysis of Ubq-PEST cleavage in vitro. Experiment was performed as described in Material and Methods. Samples were treated with indicated concentrations of AM146, RA-14 and known DUB-inhibitors, ubiquitin aldehyde (Ubal) and dibenzylideneacetone (DBA), used as a positive control. (C) Breast cancer MDA MB231 and MDA MB468 cells were treated with 5 µM AM146 for 6 h. Whole cell extracts were resolved by western blot and probed with anti-p53 antibodies. Actin is shown as a loading control. (D) Activity of purified human USP2 (240 nM) was measured as in (A). (E,F) HMEC and breast cancer MDA MB 231 cells were treated with 5 µM AM146 for 6 h. Whole cell extracts were resolved by western blot and probed with antibodies against cell cycle promoters (cyc D1) or tumor suppressors (p16Ink and p27Kip). Actin is shown as a loading control.
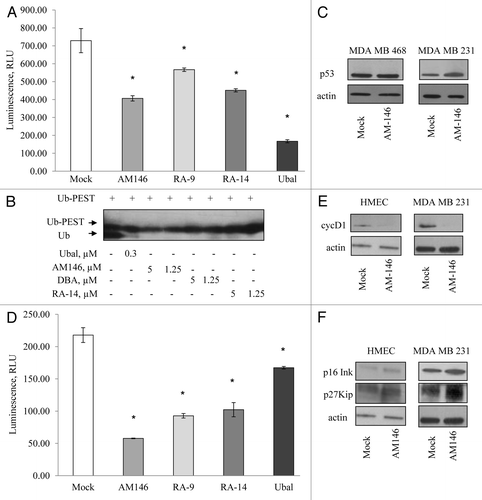
Figure 6. Chalcone-derivatives modulate expression of cell cycle promoters/tumor suppressors via altering USP activity. (A) Activity of purified human USP5 in vitro. The activity 100 nM USP5 was measured with/without 10 µM AM146, 10 µM RA-9 or 10 µM RA-14 using DUB-Glo™ Protease Assay reagent as described in Material and Methods. Treatment with 0.5 nM ubiquitin aldehyde (Ubal) was used as a positive control. Data were analyzed and plotted as in Figure 5B. (B) western blot analysis of Ubq-PEST cleavage in vitro. Experiment was performed as described in Material and Methods. Samples were treated with indicated concentrations of AM146, RA-14 and known DUB-inhibitors, ubiquitin aldehyde (Ubal) and dibenzylideneacetone (DBA), used as a positive control. (C) Breast cancer MDA MB231 and MDA MB468 cells were treated with 5 µM AM146 for 6 h. Whole cell extracts were resolved by western blot and probed with anti-p53 antibodies. Actin is shown as a loading control. (D) Activity of purified human USP2 (240 nM) was measured as in (A). (E,F) HMEC and breast cancer MDA MB 231 cells were treated with 5 µM AM146 for 6 h. Whole cell extracts were resolved by western blot and probed with antibodies against cell cycle promoters (cyc D1) or tumor suppressors (p16Ink and p27Kip). Actin is shown as a loading control.

Figure 7. Targeting cellular DUB by chalcone-derivative small molecule inhibitors irreversibly suppresses cancer but not normal cell growth. (A) Cell viability. Primary human mammary epithelial HMEC and breast cancer MDA MB231 or MDA MB468 cells were treated with indicated concentrations of AM146 for 48 h and cell viability was measured using WST-1 reagent as described in Material and Methods (“48-hrs-treated” curve). After the measurement, cells were washed, and fresh cell medium was added to cultures for 24 h. Cell viability of ‘recovered’ cells was recorded (“48-hrs-treated and 24-hrs-recovered” curve). Data points represent O.D. values as % of DMSO control ± standard error. *Indicates p ≤ 0.05. (B) Primary HMEC or cancer cells were treated with 5 μM AM146 for 48 h and cell viability was measured using WST-1 reagent as described in Material and Methods. (C) primary HMEC and breast cancer MDA MB 231 cells were treated with 5 µM AM146 for 12 h. Cells were collected, fixed, stained with propidium iodide and analyzed for DNA content by FACS analysis. Proliferating cells in different cell cycle phases were gated. Results are plotted as % of cells in G1, S or G2/M.
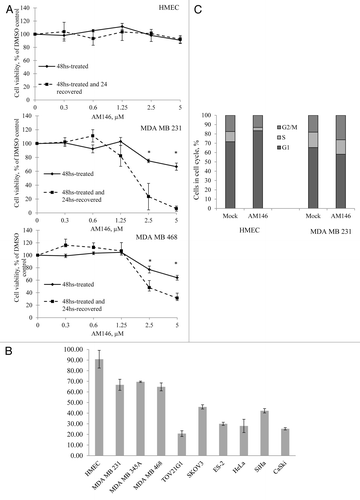
Figure 7. Targeting cellular DUB by chalcone-derivative small molecule inhibitors irreversibly suppresses cancer but not normal cell growth. (A) Cell viability. Primary human mammary epithelial HMEC and breast cancer MDA MB231 or MDA MB468 cells were treated with indicated concentrations of AM146 for 48 h and cell viability was measured using WST-1 reagent as described in Material and Methods (“48-hrs-treated” curve). After the measurement, cells were washed, and fresh cell medium was added to cultures for 24 h. Cell viability of ‘recovered’ cells was recorded (“48-hrs-treated and 24-hrs-recovered” curve). Data points represent O.D. values as % of DMSO control ± standard error. *Indicates p ≤ 0.05. (B) Primary HMEC or cancer cells were treated with 5 μM AM146 for 48 h and cell viability was measured using WST-1 reagent as described in Material and Methods. (C) primary HMEC and breast cancer MDA MB 231 cells were treated with 5 µM AM146 for 12 h. Cells were collected, fixed, stained with propidium iodide and analyzed for DNA content by FACS analysis. Proliferating cells in different cell cycle phases were gated. Results are plotted as % of cells in G1, S or G2/M.

Reprints and Corporate Permissions

Please note: Selecting permissions does not provide access to the full text of the article, please see our help page How do I view content?

To request a reprint or corporate permissions for this article, please click on the relevant link below:

Academic Permissions

Please note: Selecting permissions does not provide access to the full text of the article, please see our help page How do I view content?

Obtain permissions instantly via Rightslink by clicking on the button below:

If you are unable to obtain permissions via Rightslink, please complete and submit this Permissions form. For more information, please visit our Permissions help page.