1,826
Views
25
CrossRef citations to date
0
Altmetric
Report

Phosphoproteomic analysis of cells treated with longevity-related autophagy inducers

, , , , , & show all
Pages 1827-1840 | Published online: 01 May 2012

Figures & data

Figure 1. Determination of kinase motifs within phosphorylation sites identified from cells stimulated with resveratrol and spermidine. Hierarchical clustering of all responsive sites (sites regulated more than 2-fold upon at least one of the treatments). Black color indicates “non responsive” upon the given treatment. Cluster-specific significant linear motifs related to very high-confidence phosphorylation sites (localization probability > 0.9) are shown in the margin (requirement: at least 20 occurrences, p < 1E-6; Binomial testing).
Figure 1. Determination of kinase motifs within phosphorylation sites identified from cells stimulated with resveratrol and spermidine. Hierarchical clustering of all responsive sites (sites regulated more than 2-fold upon at least one of the treatments). Black color indicates “non responsive” upon the given treatment. Cluster-specific significant linear motifs related to very high-confidence phosphorylation sites (localization probability > 0.9) are shown in the margin (requirement: at least 20 occurrences, p < 1E-6; Binomial testing).

Figure 2. (A) Distribution of kinase motifs associated with phosphorylation sites on selected regulated substrates. High-confidence phosphorylation sites (localization probability > 0.9) were analyzed using the NetworKIN algorithm. Fisher’s exact test and Benjamini-Hochberg adjustment were performed on the kinase-substrate predictions. The color code indicates the BH-adjusted P-value. Selected weblogos are shown in the margin. (B) Cluster-specific distribution of kinase-prediction frequencies corresponding to the enriched kinases shown in (A). (C) Cell cycle arrest assay on cells treated with resveratrol and spermidine at three time points as indicated.
Figure 2. (A) Distribution of kinase motifs associated with phosphorylation sites on selected regulated substrates. High-confidence phosphorylation sites (localization probability > 0.9) were analyzed using the NetworKIN algorithm. Fisher’s exact test and Benjamini-Hochberg adjustment were performed on the kinase-substrate predictions. The color code indicates the BH-adjusted P-value. Selected weblogos are shown in the margin. (B) Cluster-specific distribution of kinase-prediction frequencies corresponding to the enriched kinases shown in (A). (C) Cell cycle arrest assay on cells treated with resveratrol and spermidine at three time points as indicated.

Figure 3. (A) Mapping of the regulated phosphoproteome to the autophagosomal interaction network (AIN) as reported by Behrends et al.Citation14 The AIN was subdivided into the ‘autophagy interactome’ (AI), the ‘central autophagy interactome’ (CAI) and the ‘autophagy core network’ (ACN). Possible false-positives retrieved fromCitation34 were included for validation. (B) Heatmap of cluster-specific autophagy responsive phosphoproteins mapped to CAI and ACN.
Figure 3. (A) Mapping of the regulated phosphoproteome to the autophagosomal interaction network (AIN) as reported by Behrends et al.Citation14 The AIN was subdivided into the ‘autophagy interactome’ (AI), the ‘central autophagy interactome’ (CAI) and the ‘autophagy core network’ (ACN). Possible false-positives retrieved fromCitation34 were included for validation. (B) Heatmap of cluster-specific autophagy responsive phosphoproteins mapped to CAI and ACN.

Figure 4. Phosphorylation-dependent signaling network of co-regulated phosphoprotein mapped to the high confidence autophagosomal interaction network from . The NetworKIN algorithm was applied to high confidence sites of this high-confidence autophagy responsive subset of phosphoproteins (localization probability > 0.9).
Figure 4. Phosphorylation-dependent signaling network of co-regulated phosphoprotein mapped to the high confidence autophagosomal interaction network from Figure 3. The NetworKIN algorithm was applied to high confidence sites of this high-confidence autophagy responsive subset of phosphoproteins (localization probability > 0.9).

Table 1. Co-regulated kinases and kinase regulators

Figure 5. Autophagy responsive phosphorylation networks interfere with networks of posttranslational/posttranscriptional modifiers suggesting extensive crosstalk. The phosphorylation network (localization probability > 0.9) of posttranslational/posttranscriptional modifiers including associated kinases was modeled by the NetworKIN algorithm. The color code indicates the cluster in which the sites are associated and the node shape indicate the class of the posttranslational/posttranscriptional modifier. Responsive kinases and co-regulated phosphoproteins are highlighted at the top and bottom.
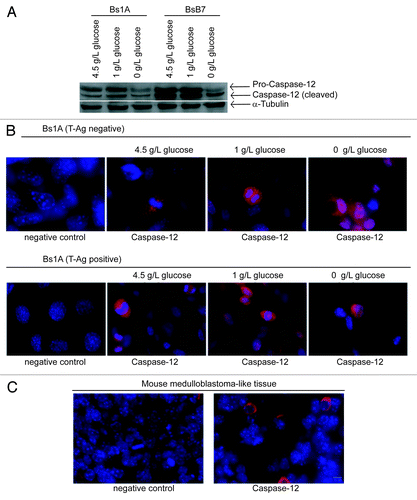
Figure 5. Autophagy responsive phosphorylation networks interfere with networks of posttranslational/posttranscriptional modifiers suggesting extensive crosstalk. The phosphorylation network (localization probability > 0.9) of posttranslational/posttranscriptional modifiers including associated kinases was modeled by the NetworKIN algorithm. The color code indicates the cluster in which the sites are associated and the node shape indicate the class of the posttranslational/posttranscriptional modifier. Responsive kinases and co-regulated phosphoproteins are highlighted at the top and bottom.

Table 2. Co-regulated apoptosis-related proteins

Figure 7. Autophagy responsive phosphorylation networks interfere with the apoptotic network, suggesting a phosphorylation dependent balancing of apoptotic and autophagic cell signal events. The phosphorylation network (localization probability > 0.9) of posttranslational/posttranscriptional modifiers including associated kinases was modeled by means of the NetworKIN algorithm. The color code indicates the cluster to which the sites are associated.
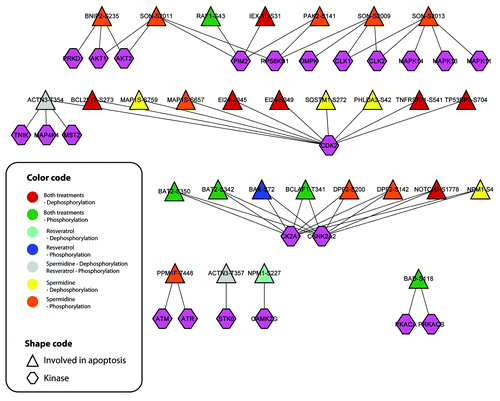
Figure 7. Autophagy responsive phosphorylation networks interfere with the apoptotic network, suggesting a phosphorylation dependent balancing of apoptotic and autophagic cell signal events. The phosphorylation network (localization probability > 0.9) of posttranslational/posttranscriptional modifiers including associated kinases was modeled by means of the NetworKIN algorithm. The color code indicates the cluster to which the sites are associated.

Figure 6. Heat map of regulated posttranslational modifiers (excluding kinases) or regulators hereof. The vertical color code indicates the class to which each phosphoprotein belongs. Black color indicates ‘non responsive’ upon the given treatment.
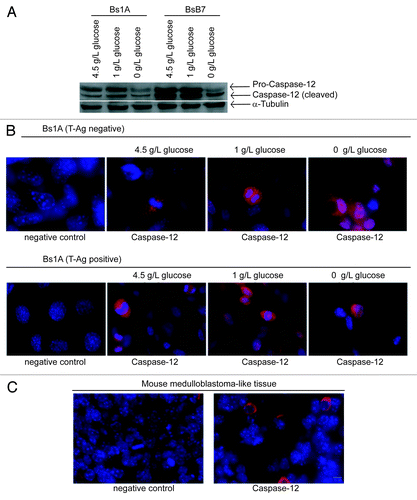
Figure 6. Heat map of regulated posttranslational modifiers (excluding kinases) or regulators hereof. The vertical color code indicates the class to which each phosphoprotein belongs. Black color indicates ‘non responsive’ upon the given treatment.
Supplemental material

Additional material

Download Zip (8.2 MB)

Reprints and Corporate Permissions

Please note: Selecting permissions does not provide access to the full text of the article, please see our help page How do I view content?

To request a reprint or corporate permissions for this article, please click on the relevant link below:

Academic Permissions

Please note: Selecting permissions does not provide access to the full text of the article, please see our help page How do I view content?

Obtain permissions instantly via Rightslink by clicking on the button below:

If you are unable to obtain permissions via Rightslink, please complete and submit this Permissions form. For more information, please visit our Permissions help page.