786
Views
15
CrossRef citations to date
0
Altmetric
Report

LIN54 harboring a mutation in CHC domain is localized to the cytoplasm and inhibits cell cycle progression

, , , &
Pages 3227-3236 | Published online: 16 Aug 2012

Figures & data

Figure 1. Expression of Lin54 in various mouse tissues was analyzed by RT-PCR. All tissues were excised from 7-week-old male ICR mouse. Gapdh was used as an internal control.
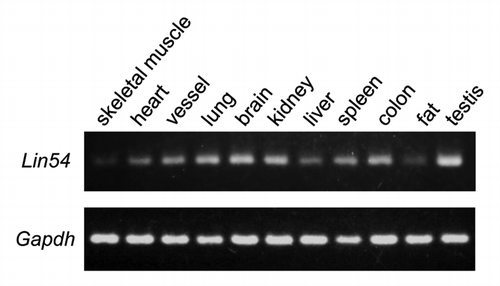
Figure 1. Expression of Lin54 in various mouse tissues was analyzed by RT-PCR. All tissues were excised from 7-week-old male ICR mouse. Gapdh was used as an internal control.

Figure 2. Subcellular localization of LIN54. (A) GC-1 cells were infected with recombinant adenovirus expressing wild-type LIN54-EGFP. At 24 h after infection, the cells were fixed and EGFP-fused proteins were detected using fluorescent microscope. Nuclei were stained with DPAI. (B) The upper panels show examples of cytoplasmic localizations of LIN54. The lower panels are the result of observing the same field of view shown in the upper panels after leptomycin B treatment. Leptomycin B treatment (20 nM) was performed for 4 h. The phase panels show the corresponding field visualized by phase-contrast microscopy. (C) GC-1 cells were cultured in 0.1% FBS for 48 h and then infected with the recombinant adenovirus. After infection, cells were cultured in 0.1% FBS for 24 h and then LIN54-EGFP was detected. Serum-starved cells were stimulated with serum for 10 h. The scale bar is 50 μM.
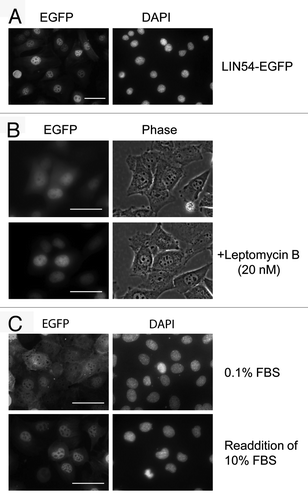
Figure 2. Subcellular localization of LIN54. (A) GC-1 cells were infected with recombinant adenovirus expressing wild-type LIN54-EGFP. At 24 h after infection, the cells were fixed and EGFP-fused proteins were detected using fluorescent microscope. Nuclei were stained with DPAI. (B) The upper panels show examples of cytoplasmic localizations of LIN54. The lower panels are the result of observing the same field of view shown in the upper panels after leptomycin B treatment. Leptomycin B treatment (20 nM) was performed for 4 h. The phase panels show the corresponding field visualized by phase-contrast microscopy. (C) GC-1 cells were cultured in 0.1% FBS for 48 h and then infected with the recombinant adenovirus. After infection, cells were cultured in 0.1% FBS for 24 h and then LIN54-EGFP was detected. Serum-starved cells were stimulated with serum for 10 h. The scale bar is 50 μM.

Figure 3. Constructs of various LIN54 mutants. (A) Schematic representation of LIN54 mutants. Fragments of LIN54 were ligated in frame with one of various epitope tags (EGFP, FLAG and HA). EGFP and HA epitope tag were fused to the C terminus and FLAG epitope tag was fused to the N terminus. DNA constructs encoding these mutants were inserted into adenoviral vectors. (B) GC-1 cells were infected with each recombinant adenovirus and then LIN54 and mutant proteins were detected by western blot with indicated antibodies. β-tubulin is a loading control. (C) Alignment of the amino acid sequence of CXC domains with those of other CHC family proteins. Conserved cysteine residues are shaded in black. The asterisks represent the point-mutated cysteine residues (C525 and C611).
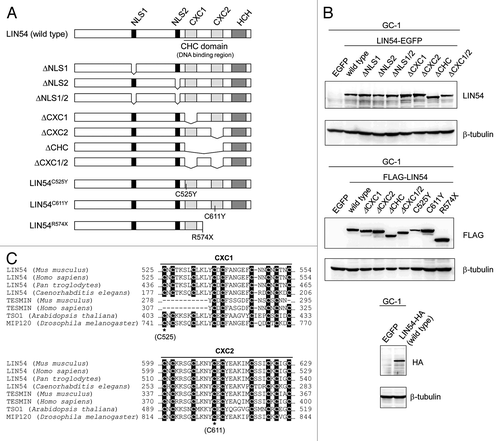
Figure 3. Constructs of various LIN54 mutants. (A) Schematic representation of LIN54 mutants. Fragments of LIN54 were ligated in frame with one of various epitope tags (EGFP, FLAG and HA). EGFP and HA epitope tag were fused to the C terminus and FLAG epitope tag was fused to the N terminus. DNA constructs encoding these mutants were inserted into adenoviral vectors. (B) GC-1 cells were infected with each recombinant adenovirus and then LIN54 and mutant proteins were detected by western blot with indicated antibodies. β-tubulin is a loading control. (C) Alignment of the amino acid sequence of CXC domains with those of other CHC family proteins. Conserved cysteine residues are shaded in black. The asterisks represent the point-mutated cysteine residues (C525 and C611).

Figure 4. Subcellular localization of LIN54 NLS mutants. GC-1 cells were infected with recombinant adenoviruses expressing the indicated constructs. At 24 h after infection, the cells were fixed and EGFP-fused proteins were detected using fluorescent microscope. Nuclei were stained with DPAI. The scale bar is 50 μM.
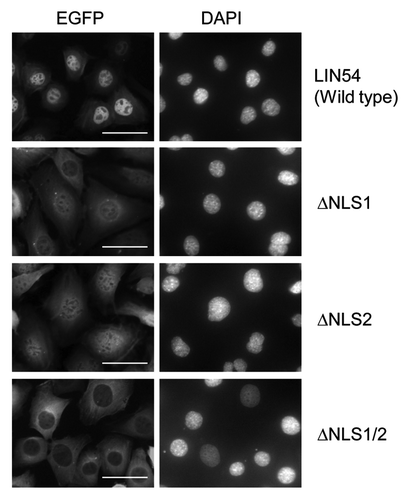
Figure 4. Subcellular localization of LIN54 NLS mutants. GC-1 cells were infected with recombinant adenoviruses expressing the indicated constructs. At 24 h after infection, the cells were fixed and EGFP-fused proteins were detected using fluorescent microscope. Nuclei were stained with DPAI. The scale bar is 50 μM.

Figure 5. Subcellular localization of LIN54 harboring mutations in CHC domain. (A) GC-1 cells were infected with recombinant adenoviruses expressing the indicated constructs. At 24 h after infection, the cells were fixed, and EGFP-fused proteins were detected using fluorescent microscope. Leptomycin B treatment (20 nM) was performed for 4 h prior to fixation. Nuclei were stained with DPAI. (B) FLAG-tagged LIN54 mutants were visualized by immunostaining with anti-FLAG antibody. The scale bar is 50 μM.
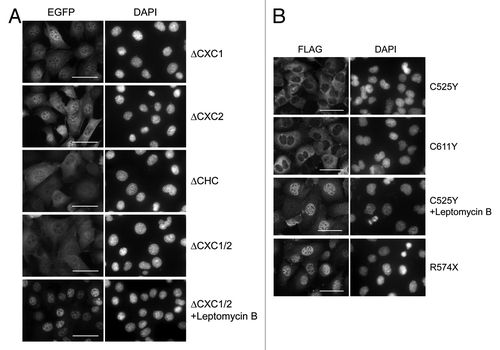
Figure 5. Subcellular localization of LIN54 harboring mutations in CHC domain. (A) GC-1 cells were infected with recombinant adenoviruses expressing the indicated constructs. At 24 h after infection, the cells were fixed, and EGFP-fused proteins were detected using fluorescent microscope. Leptomycin B treatment (20 nM) was performed for 4 h prior to fixation. Nuclei were stained with DPAI. (B) FLAG-tagged LIN54 mutants were visualized by immunostaining with anti-FLAG antibody. The scale bar is 50 μM.

Table 2. Nuclear aberrations in GC-1 cells expressing LIN54 mutants

Figure 6. LIN54 CHC mutants lead to nuclear aberrations and impede cell cycle progression. (A) Examples of nuclear abnormalities in GC-1 cells expressing FLAG-LIN54C525Y. At 36 h after infection, cells were fixed and stained with DAPI and FITC-phalloidin that binds specifically to F-actin. The arrows indicate cells with abnormal nuclear morphology. (B) GC-1 cells expressing EGFP (filled diamond), FLAG-LIN54 (open square), FLAG-LIN54(ΔCXC1/2) (open diamond), FLAG-LIN54C525Y (open circle) or FLAG-LIN54C611Y (filled triangle) were seeded at 1 x 10⁵ cells per dish in triplicate and counted at indicated time points. The experiment was performed three times. One representative experiment is shown. Error bars represent standard deviation. (C) GC-1 cells were infected with recombinant adenoviruses expressing the indicated constructs. At 24 or 36 h after infection, the cells were fixed and stained with PI. The cell cycle profiles were determined by flow cytometry. (D) GC-1 cells were infected with recombinant adenoviruses expressing EGFP (black bars), FLAG-LIN54 (white bars), FLAG-LIN54(ΔCXC1/2) (dark gray bars), or FLAG-LIN54C525Y (light gray bars). At 24 h after infection, cyclin A2, cyclin B1 and Cdc2 expression were analyzed by quantitative RT-PCR. Relative expression was normalized to Gapdh. Error bars represent standard deviation.
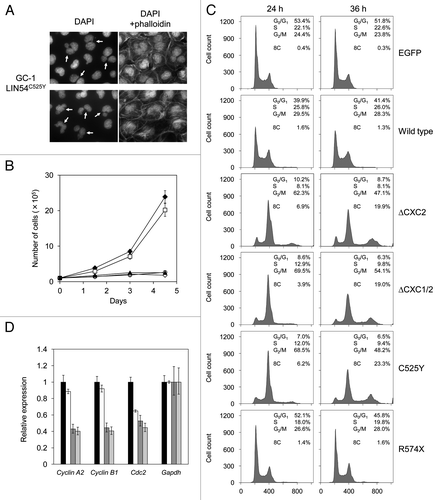
Figure 6. LIN54 CHC mutants lead to nuclear aberrations and impede cell cycle progression. (A) Examples of nuclear abnormalities in GC-1 cells expressing FLAG-LIN54C525Y. At 36 h after infection, cells were fixed and stained with DAPI and FITC-phalloidin that binds specifically to F-actin. The arrows indicate cells with abnormal nuclear morphology. (B) GC-1 cells expressing EGFP (filled diamond), FLAG-LIN54 (open square), FLAG-LIN54(ΔCXC1/2) (open diamond), FLAG-LIN54C525Y (open circle) or FLAG-LIN54C611Y (filled triangle) were seeded at 1 x 10⁵ cells per dish in triplicate and counted at indicated time points. The experiment was performed three times. One representative experiment is shown. Error bars represent standard deviation. (C) GC-1 cells were infected with recombinant adenoviruses expressing the indicated constructs. At 24 or 36 h after infection, the cells were fixed and stained with PI. The cell cycle profiles were determined by flow cytometry. (D) GC-1 cells were infected with recombinant adenoviruses expressing EGFP (black bars), FLAG-LIN54 (white bars), FLAG-LIN54(ΔCXC1/2) (dark gray bars), or FLAG-LIN54C525Y (light gray bars). At 24 h after infection, cyclin A2, cyclin B1 and Cdc2 expression were analyzed by quantitative RT-PCR. Relative expression was normalized to Gapdh. Error bars represent standard deviation.
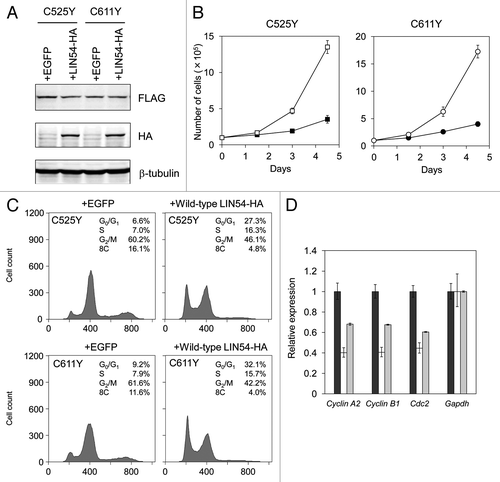
Figure 7. Wild-type LIN54 partially restores the cell cycle progression. (A) FLAG-LIN54C525Y, FLAG-LIN54C611Y and LIN54-HA expression were confirmed by western blotting with indicated antibodies. β-tubulin is a loading control. (B) GC-1 cells expressing FLAG-LIN54C525Y +EGFP (filled square), FLAG-LIN54C525Y +LIN54-HA (open square), FLAG-LIN54C611Y +EGFP (filled circle) or FLAG-LIN54C611Y +LIN54-HA (open circle) were seeded at 1 x 10⁵ cells per dish in triplicate and counted at the indicated time points. The experiment was performed three times. One representative experiment is shown. Error bars represent standard deviation. (C) GC-1 cells were coinfected with recombinant adenoviruses expressing the indicated constructs. At 36 h after infection, the cells were fixed and stained with PI. The cell cycle profiles were determined by flow cytometry. (D) GC-1 cells were infected with recombinant adenoviruses expressing EGFP (black bars), FLAG-LIN54C525Y +EGFP (white bars) or FLAG-LIN54C525Y +LIN54-HA (gray bars). At 24 h after infection, Cyclin A2, Cyclin B1, and Cdc2 expression were analyzed by quantitative RT-PCR. Relative expression was normalized to Gapdh. Error bars represent standard deviation.

Figure 7. Wild-type LIN54 partially restores the cell cycle progression. (A) FLAG-LIN54C525Y, FLAG-LIN54C611Y and LIN54-HA expression were confirmed by western blotting with indicated antibodies. β-tubulin is a loading control. (B) GC-1 cells expressing FLAG-LIN54C525Y +EGFP (filled square), FLAG-LIN54C525Y +LIN54-HA (open square), FLAG-LIN54C611Y +EGFP (filled circle) or FLAG-LIN54C611Y +LIN54-HA (open circle) were seeded at 1 x 10⁵ cells per dish in triplicate and counted at the indicated time points. The experiment was performed three times. One representative experiment is shown. Error bars represent standard deviation. (C) GC-1 cells were coinfected with recombinant adenoviruses expressing the indicated constructs. At 36 h after infection, the cells were fixed and stained with PI. The cell cycle profiles were determined by flow cytometry. (D) GC-1 cells were infected with recombinant adenoviruses expressing EGFP (black bars), FLAG-LIN54C525Y +EGFP (white bars) or FLAG-LIN54C525Y +LIN54-HA (gray bars). At 24 h after infection, Cyclin A2, Cyclin B1, and Cdc2 expression were analyzed by quantitative RT-PCR. Relative expression was normalized to Gapdh. Error bars represent standard deviation.

Table 1. Primers used in this study

Reprints and Corporate Permissions

Please note: Selecting permissions does not provide access to the full text of the article, please see our help page How do I view content?

To request a reprint or corporate permissions for this article, please click on the relevant link below:

Academic Permissions

Please note: Selecting permissions does not provide access to the full text of the article, please see our help page How do I view content?

Obtain permissions instantly via Rightslink by clicking on the button below:

If you are unable to obtain permissions via Rightslink, please complete and submit this Permissions form. For more information, please visit our Permissions help page.