714
Views
16
CrossRef citations to date
0
Altmetric
Report

Overexpression of EVI1 interferes with cytokinesis and leads to accumulation of cells with supernumerary centrosomes in G0/1 phase

, , , , &
Pages 3492-3503 | Published online: 16 Aug 2012

Figures & data

Figure 1. Overexpression of EVI1 leads to centrosomal aberrations. (A) In U2OS cells conditionally overexpressing EVI1-HA, transgene expression was induced for 72 h. Cells were immunostained for HA (red). DNA was counterstained with DAPI (blue). Scale bars represent 10 μm. (B) Overexpression of EVI1-HA was induced for 48 or 72 h, followed by immunoblotting for EVI1-HA or the loading control actin using 50 µg of protein extract from parental U2OS cells, uninduced (-TET) and induced (+TET) U2OS cells conditionally overexpressing EVI1-HA. (C) In U2OS cells conditionally overexpressing EVI1-HA, transgene expression was induced for 72 h. Parental U2OS cells, uninduced (-TET) and induced (+TET) U2OS cells conditionally overexpressing EVI1-HA were immunostained for γ-tubulin (green) and EVI1-HA (red). DNA was counterstained with DAPI (blue). Scale bars represent 10 μm. Insets show centrosomes at higher magnification. (D) U2OS cells conditionally overexpressing EVI1-HA were left untreated (-TET) or induced to express the transgene for 48 or 72 h (+TET). Parental U2OS cells were grown in parallel. Following immunostaining as in (C), percentages of cells with more than two centrosomes were quantified in 4 × 100 cells per data bar. ***, this difference is highly significant (p = 0.00011). **, this difference is significant (p = 0.0055). (E) U2OS cells conditionally overexpressing EVI1-HA and parental U2OS cells were transfected with CETN2-Dendra2 (green). Twenty-four h later, transgene expression was induced where indicated (+TET). Cells were harvested 72 h after transgene induction and immunostained for γ-tubulin (red). DNA was counterstained with DAPI (blue). Scale bars represent 10 μm. Insets show centrosomes at higher magnification. (F) The observations shown in (E) were quantified by evaluating 3 × 50 transfected cells per data bar, which were categorized as specified in the figure. ***, this difference is highly significant (p = 0.00097).
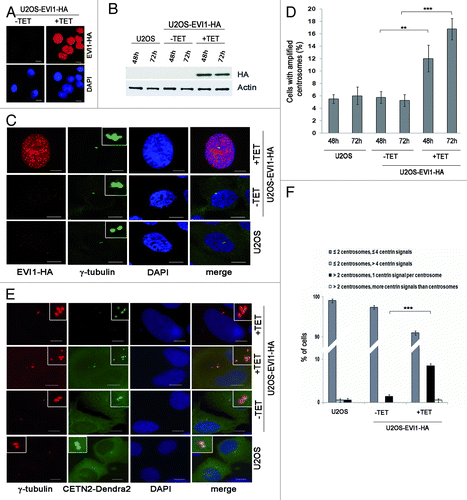
Figure 1. Overexpression of EVI1 leads to centrosomal aberrations. (A) In U2OS cells conditionally overexpressing EVI1-HA, transgene expression was induced for 72 h. Cells were immunostained for HA (red). DNA was counterstained with DAPI (blue). Scale bars represent 10 μm. (B) Overexpression of EVI1-HA was induced for 48 or 72 h, followed by immunoblotting for EVI1-HA or the loading control actin using 50 µg of protein extract from parental U2OS cells, uninduced (-TET) and induced (+TET) U2OS cells conditionally overexpressing EVI1-HA. (C) In U2OS cells conditionally overexpressing EVI1-HA, transgene expression was induced for 72 h. Parental U2OS cells, uninduced (-TET) and induced (+TET) U2OS cells conditionally overexpressing EVI1-HA were immunostained for γ-tubulin (green) and EVI1-HA (red). DNA was counterstained with DAPI (blue). Scale bars represent 10 μm. Insets show centrosomes at higher magnification. (D) U2OS cells conditionally overexpressing EVI1-HA were left untreated (-TET) or induced to express the transgene for 48 or 72 h (+TET). Parental U2OS cells were grown in parallel. Following immunostaining as in (C), percentages of cells with more than two centrosomes were quantified in 4 × 100 cells per data bar. ***, this difference is highly significant (p = 0.00011). **, this difference is significant (p = 0.0055). (E) U2OS cells conditionally overexpressing EVI1-HA and parental U2OS cells were transfected with CETN2-Dendra2 (green). Twenty-four h later, transgene expression was induced where indicated (+TET). Cells were harvested 72 h after transgene induction and immunostained for γ-tubulin (red). DNA was counterstained with DAPI (blue). Scale bars represent 10 μm. Insets show centrosomes at higher magnification. (F) The observations shown in (E) were quantified by evaluating 3 × 50 transfected cells per data bar, which were categorized as specified in the figure. ***, this difference is highly significant (p = 0.00097).

Figure 2. EVI1-overexpressing cells show abnormal nuclei. (A) In U2OS cells conditionally overexpressing EVI1-HA, transgene expression was induced for 72 h. Cells were immunostained for γ-tubulin (green) and EVI1-HA (red). DNA was counterstained with DAPI (blue). Scale bars represent 10 μm. Insets show centrosomes at higher magnification. (B) U2OS cells conditionally overexpressing EVI1-HA were left untreated (-TET) or induced to express the transgene for 72 h (+TET). Parental U2OS cells were grown in parallel. Following immunostaining as in (A), percentages of cells with more than two centrosomes and the nuclear morphology detailed in the figure were quantified in 3 × 100 cells per data bar. ***, this difference is highly significant (p = 0.00021). **, this difference is significant (p = 0.00312).
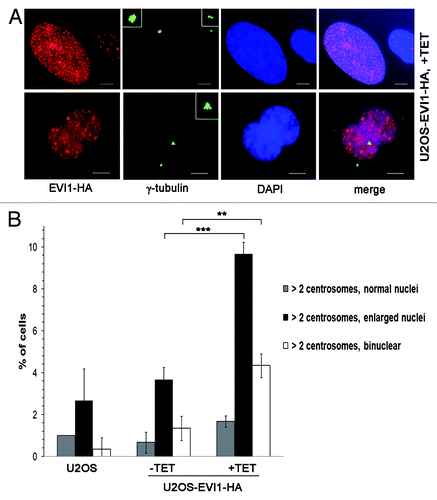
Figure 2. EVI1-overexpressing cells show abnormal nuclei. (A) In U2OS cells conditionally overexpressing EVI1-HA, transgene expression was induced for 72 h. Cells were immunostained for γ-tubulin (green) and EVI1-HA (red). DNA was counterstained with DAPI (blue). Scale bars represent 10 μm. Insets show centrosomes at higher magnification. (B) U2OS cells conditionally overexpressing EVI1-HA were left untreated (-TET) or induced to express the transgene for 72 h (+TET). Parental U2OS cells were grown in parallel. Following immunostaining as in (A), percentages of cells with more than two centrosomes and the nuclear morphology detailed in the figure were quantified in 3 × 100 cells per data bar. ***, this difference is highly significant (p = 0.00021). **, this difference is significant (p = 0.00312).

Figure 3. EVI1 overexpression is associated with cytokinesis defects. U2OS cells conditionally overexpressing EVI1-HA were monitored by time-lapse microscopy for 72 h following induction of transgene expression. A representative example of an EVI1-overexpressing cell undergoing mitosis is marked by arrowheads: after an apparently normal mitosis and karyokinesis, cytokinesis remains incomplete, resulting in a binuclear cell. Elapsed times after start of observation are given as hours:minutes.
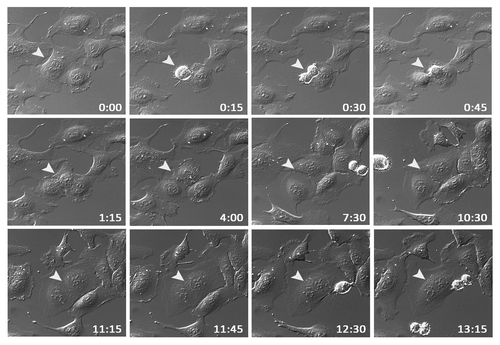
Figure 3. EVI1 overexpression is associated with cytokinesis defects. U2OS cells conditionally overexpressing EVI1-HA were monitored by time-lapse microscopy for 72 h following induction of transgene expression. A representative example of an EVI1-overexpressing cell undergoing mitosis is marked by arrowheads: after an apparently normal mitosis and karyokinesis, cytokinesis remains incomplete, resulting in a binuclear cell. Elapsed times after start of observation are given as hours:minutes.

Figure 4. EVI1 overexpression leads to accumulation of cells in G0/1 phase. (A) Parental U2OS cells, uninduced (-TET) and induced (+TET) U2OS cells conditionally overexpressing EVI1-HA were cultured for 72 h. After 7-AAD staining, the DNA content was measured by flow cytometry. (B) Lysates of parental U2OS cells, uninduced (-TET) and induced (+TET) U2OS cells conditionally overexpressing EVI1 were prepared at the indicated time points after transgene induction, followed by immunoblotting for the indicated proteins. (C) U2OS cells conditionally overexpressing EVI1-HA were induced to express the transgene (+TET) or left uninduced (-TET) for 72 h, followed by immunoprecipitation of Cdk2 from 50 µg protein per lane and an in vitro kinase assay using histone H1 as a substrate to measure Cdk2 activity (upper right panel). Negative controls included induced cells where the Cdk2 antibody or lysate was omitted during immunoprecipitation, or the immunoprecipitate was heated to 95°C for 5 min (upper left panel, from left to right). Immunoblots for HA and actin were prepared in parallel, showing induction of EVI1-HA after 72 h (lower panel). (D) The in vitro kinase assay of Cdk2 activity as described in (C) was reproduced using U2OS cells retrovirally transduced to conditionally overexpress EVI1, with the minor modification that 100 µg protein per lane was used for immunoprecipitation, and that the immunoblot used to demonstrate transgene overexpression was performed with an antibody to EVI1.
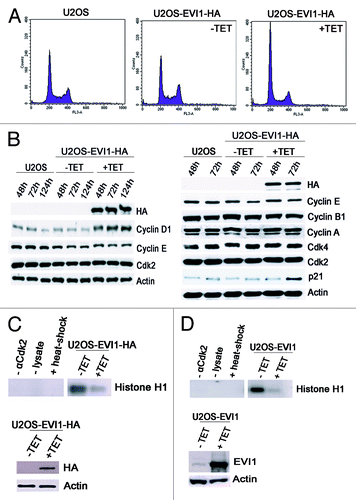
Figure 4. EVI1 overexpression leads to accumulation of cells in G0/1 phase. (A) Parental U2OS cells, uninduced (-TET) and induced (+TET) U2OS cells conditionally overexpressing EVI1-HA were cultured for 72 h. After 7-AAD staining, the DNA content was measured by flow cytometry. (B) Lysates of parental U2OS cells, uninduced (-TET) and induced (+TET) U2OS cells conditionally overexpressing EVI1 were prepared at the indicated time points after transgene induction, followed by immunoblotting for the indicated proteins. (C) U2OS cells conditionally overexpressing EVI1-HA were induced to express the transgene (+TET) or left uninduced (-TET) for 72 h, followed by immunoprecipitation of Cdk2 from 50 µg protein per lane and an in vitro kinase assay using histone H1 as a substrate to measure Cdk2 activity (upper right panel). Negative controls included induced cells where the Cdk2 antibody or lysate was omitted during immunoprecipitation, or the immunoprecipitate was heated to 95°C for 5 min (upper left panel, from left to right). Immunoblots for HA and actin were prepared in parallel, showing induction of EVI1-HA after 72 h (lower panel). (D) The in vitro kinase assay of Cdk2 activity as described in (C) was reproduced using U2OS cells retrovirally transduced to conditionally overexpress EVI1, with the minor modification that 100 µg protein per lane was used for immunoprecipitation, and that the immunoblot used to demonstrate transgene overexpression was performed with an antibody to EVI1.

Figure 5. EVI1 overexpression induces activation of the p53 pathway. (A) Parental U2OS cells, uninduced (-TET) and induced (+TET) U2OS cells conditionally overexpressing EVI1-HA were harvested 72 h after induction of transgene expression and immunostained for HA (red) and p53 (green). DNA was counterstained with DAPI (blue). Scale bars represent 10 µm. (B) The observations shown in (A) were quantified by counting cells displaying nuclear positivity for p53. Results are given as mean ± SD of 3 × 100 cells per data bar. **, these differences are significant (p = 0.0015 and p = 0.0010 for the comparison with uninduced EVI1-HA and parental U2OS cells, respectively). (C) Parental U2OS cells, uninduced (-TET) and induced (+TET) U2OS cells conditionally overexpressing EVI1-HA were harvested 72 h after induction of transgene expression and immunostained for HA (red) and p21 (green). DNA was counterstained with DAPI (blue). Scale bars represent 10 µm. (D) The observations shown in (C) were quantified by counting cells displaying nuclear positivity for p21. Results are given as mean ± SD of 3 × 100 cells per data bar. ***, these differences are highly significant (p = 0.00055 and p = 0.00018 for the comparison with uninduced EVI1-HA and parental U2OS cells, respectively).
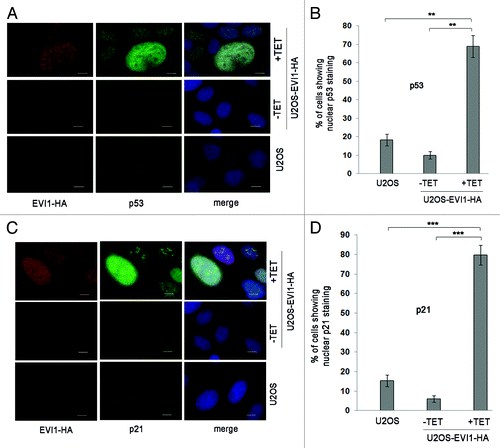
Figure 5. EVI1 overexpression induces activation of the p53 pathway. (A) Parental U2OS cells, uninduced (-TET) and induced (+TET) U2OS cells conditionally overexpressing EVI1-HA were harvested 72 h after induction of transgene expression and immunostained for HA (red) and p53 (green). DNA was counterstained with DAPI (blue). Scale bars represent 10 µm. (B) The observations shown in (A) were quantified by counting cells displaying nuclear positivity for p53. Results are given as mean ± SD of 3 × 100 cells per data bar. **, these differences are significant (p = 0.0015 and p = 0.0010 for the comparison with uninduced EVI1-HA and parental U2OS cells, respectively). (C) Parental U2OS cells, uninduced (-TET) and induced (+TET) U2OS cells conditionally overexpressing EVI1-HA were harvested 72 h after induction of transgene expression and immunostained for HA (red) and p21 (green). DNA was counterstained with DAPI (blue). Scale bars represent 10 µm. (D) The observations shown in (C) were quantified by counting cells displaying nuclear positivity for p21. Results are given as mean ± SD of 3 × 100 cells per data bar. ***, these differences are highly significant (p = 0.00055 and p = 0.00018 for the comparison with uninduced EVI1-HA and parental U2OS cells, respectively).

Figure 6. Further polyploidization of EVI1-induced tetraploid cells is inhibited by p53. (A) Parental U2OS cells and U2OS cells conditionally overexpressing EVI1-HA were transfected with siRNAs targeting luciferase (siluc) or p53 (sip53), respectively. Twenty-four hours later, transgene expression was induced where indicated (+TET), and cells were harvested 72 h thereafter, followed by immunoblotting for the indicated proteins. (B) U2OS cells retrovirally transduced to conditionally overexpress EVI1 were treated as in (A), followed by immunoblotting for the indicated proteins. (C) U2OS cells conditionally overexpressing EVI1-HA were transfected with siRNAs targeting luciferase (siluc) or p53 (sip53), respectively. Twenty-four hours later, transgene expression was induced where indicated (+TET), and cells were harvested 72 h thereafter, followed by immunostaining for HA (red) and γ-tubulin (green). DNA was counterstained with DAPI (blue). Scale bars represent 10 µm. Insets show centrosomes at higher magnification. (D) U2OS cells conditionally overexpressing EVI1-HA were transfected with siRNAs targeting luciferase (siluc) or p53 (sip53), respectively. Twenty-four hours later, transgene expression was induced where indicated (+TET), and cells were harvested 72 h thereafter, followed by flow-cytometric analysis of DNA content. This included gating in cells of interest (blue) by excluding doublets, followed by defining regions containing cells with 8N DNA (red), corresponding to the given percentages, or more than 4N DNA (not shown). The complete data are listed in Table S1. (E) Flow-cytometric analysis of polyploidization was performed exactly as described in (D), except that U2OS cells retrovirally transduced to conditionally overexpress EVI1 were used. The complete data are listed in Table S1.
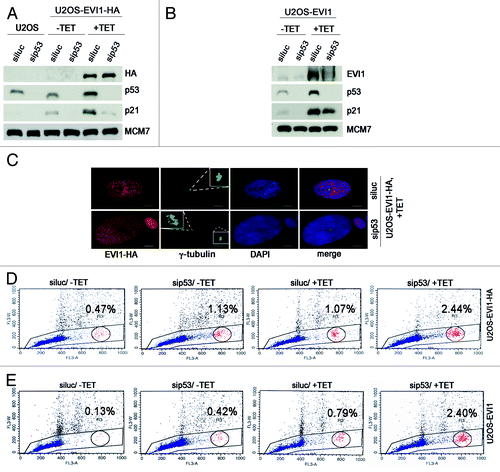
Figure 6. Further polyploidization of EVI1-induced tetraploid cells is inhibited by p53. (A) Parental U2OS cells and U2OS cells conditionally overexpressing EVI1-HA were transfected with siRNAs targeting luciferase (siluc) or p53 (sip53), respectively. Twenty-four hours later, transgene expression was induced where indicated (+TET), and cells were harvested 72 h thereafter, followed by immunoblotting for the indicated proteins. (B) U2OS cells retrovirally transduced to conditionally overexpress EVI1 were treated as in (A), followed by immunoblotting for the indicated proteins. (C) U2OS cells conditionally overexpressing EVI1-HA were transfected with siRNAs targeting luciferase (siluc) or p53 (sip53), respectively. Twenty-four hours later, transgene expression was induced where indicated (+TET), and cells were harvested 72 h thereafter, followed by immunostaining for HA (red) and γ-tubulin (green). DNA was counterstained with DAPI (blue). Scale bars represent 10 µm. Insets show centrosomes at higher magnification. (D) U2OS cells conditionally overexpressing EVI1-HA were transfected with siRNAs targeting luciferase (siluc) or p53 (sip53), respectively. Twenty-four hours later, transgene expression was induced where indicated (+TET), and cells were harvested 72 h thereafter, followed by flow-cytometric analysis of DNA content. This included gating in cells of interest (blue) by excluding doublets, followed by defining regions containing cells with 8N DNA (red), corresponding to the given percentages, or more than 4N DNA (not shown). The complete data are listed in Table S1. (E) Flow-cytometric analysis of polyploidization was performed exactly as described in (D), except that U2OS cells retrovirally transduced to conditionally overexpress EVI1 were used. The complete data are listed in Table S1.

Figure 7. EVI1-overexpressing cells harboring centrosome aberrations show low Ki-67 levels. (A) Parental U2OS cells, uninduced (-TET) and induced (+TET) U2OS cells conditionally overexpressing EVI1-HA were harvested 72 h after induction of transgene expression and immunostained for γ-tubulin (green) and Ki-67 (red). DNA was counterstained with DAPI (blue). Scale bars represent 10 µm. Insets show centrosomes at higher magnification. (B) U2OS cells conditionally overexpressing EVI1-HA were left untreated (-TET) or induced to express the transgene for 72 h (+TET). Parental U2OS cells were grown in parallel. Following immunostaining as in (A), percentages of cells with more than two2 centrosomes were quantified and given in relation to the Ki-67 staining intensity in 3 × 100 cells per data bar. ***, all indicated differences are highly significant (p < 0.0001).
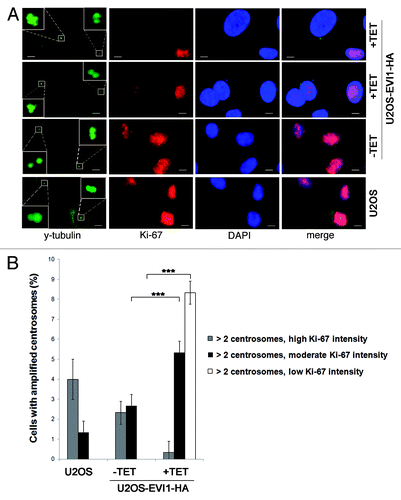
Figure 7. EVI1-overexpressing cells harboring centrosome aberrations show low Ki-67 levels. (A) Parental U2OS cells, uninduced (-TET) and induced (+TET) U2OS cells conditionally overexpressing EVI1-HA were harvested 72 h after induction of transgene expression and immunostained for γ-tubulin (green) and Ki-67 (red). DNA was counterstained with DAPI (blue). Scale bars represent 10 µm. Insets show centrosomes at higher magnification. (B) U2OS cells conditionally overexpressing EVI1-HA were left untreated (-TET) or induced to express the transgene for 72 h (+TET). Parental U2OS cells were grown in parallel. Following immunostaining as in (A), percentages of cells with more than two2 centrosomes were quantified and given in relation to the Ki-67 staining intensity in 3 × 100 cells per data bar. ***, all indicated differences are highly significant (p < 0.0001).

Figure 8. EVI1 overexpression interferes with proliferation and induces a negative feedback loop. (A) Of parental U2OS cells, uninduced (-TET) and induced (+TET) U2OS cells conditionally overexpressing EVI1-HA, a measure of 200,000 cells per dish was seeded. At the indicated time points, cells were harvested and counted again to determine proliferation rates. Results are given as mean absolute numbers of cells from two experiments. ***, this difference is highly significant (p = 0.00035). **, these differences are significant (p < 0.009). (B) In U2OS cells conditionally overexpressing EVI1-HA, transgene expression was induced for the indicated times, and tetracycline-containing medium was renewed every 48 h. Using 70 µg of protein extract per lane from induced cells (+TET) or uninduced controls (-TET), immunoblots for HA and the loading control actin were prepared.
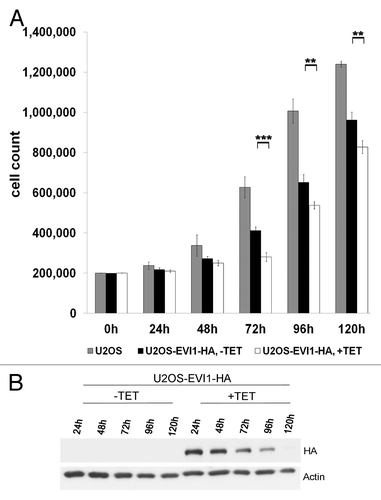
Figure 8. EVI1 overexpression interferes with proliferation and induces a negative feedback loop. (A) Of parental U2OS cells, uninduced (-TET) and induced (+TET) U2OS cells conditionally overexpressing EVI1-HA, a measure of 200,000 cells per dish was seeded. At the indicated time points, cells were harvested and counted again to determine proliferation rates. Results are given as mean absolute numbers of cells from two experiments. ***, this difference is highly significant (p = 0.00035). **, these differences are significant (p < 0.009). (B) In U2OS cells conditionally overexpressing EVI1-HA, transgene expression was induced for the indicated times, and tetracycline-containing medium was renewed every 48 h. Using 70 µg of protein extract per lane from induced cells (+TET) or uninduced controls (-TET), immunoblots for HA and the loading control actin were prepared.
Supplemental material

Additional material

Download Zip (239.6 KB)

Reprints and Corporate Permissions

Please note: Selecting permissions does not provide access to the full text of the article, please see our help page How do I view content?

To request a reprint or corporate permissions for this article, please click on the relevant link below:

Academic Permissions

Please note: Selecting permissions does not provide access to the full text of the article, please see our help page How do I view content?

Obtain permissions instantly via Rightslink by clicking on the button below:

If you are unable to obtain permissions via Rightslink, please complete and submit this Permissions form. For more information, please visit our Permissions help page.