1,325
Views
29
CrossRef citations to date
0
Altmetric
Report

Cyclosporin A inhibits colon cancer cell growth independently of the calcineurin pathway

, , &
Pages 3997-4008 | Published online: 19 Sep 2012

Figures & data

Figure 1. CACO-2 cells are sensitive to CsA but not FK506 in culture. (A) CACO-2 ,cells were cultured in the presence of CsA (2 μM), FK506 (2 μM) or Rapa (20 nM) for 4 d. At each time point samples were fixed and stained with violet crystal (left panel), or at 96 h of culture cell were trypsinized and counted (trypan blue-negative cells; right graph). Results are the mean of three to 17 independent experiments. * marks p < 0.05 when compared with CT group. (B) Clonogenic assay of CACO-2 cells cultured in the presence of specific inhibitors as in panel A. Results are representative of seven independent experiments. (C) Quantification of colony number and area from experiment shown in B. Results are the mean of 12 independent experiments. * marks p < 0.05 when comparing to CT group. (D) Colon carcinoma cell lines were cultured in the presence of indicated inhibitors at concentrations depicted in panel A for 96 h and stained with violet crystal. Results are the mean of three to six independent experiments. * marks p < 0.05 when comparing to CT group. (E) Clonogenic assay of colon carcinoma cell lines cultured in the presence of specific inhibitors as in (B). Results are representative of three independent experiments.
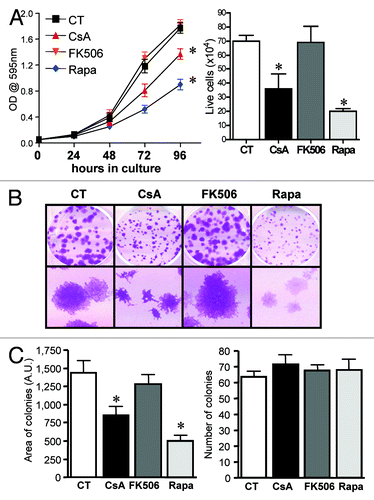
Figure 1. CACO-2 cells are sensitive to CsA but not FK506 in culture. (A) CACO-2 ,cells were cultured in the presence of CsA (2 μM), FK506 (2 μM) or Rapa (20 nM) for 4 d. At each time point samples were fixed and stained with violet crystal (left panel), or at 96 h of culture cell were trypsinized and counted (trypan blue-negative cells; right graph). Results are the mean of three to 17 independent experiments. * marks p < 0.05 when compared with CT group. (B) Clonogenic assay of CACO-2 cells cultured in the presence of specific inhibitors as in panel A. Results are representative of seven independent experiments. (C) Quantification of colony number and area from experiment shown in B. Results are the mean of 12 independent experiments. * marks p < 0.05 when comparing to CT group. (D) Colon carcinoma cell lines were cultured in the presence of indicated inhibitors at concentrations depicted in panel A for 96 h and stained with violet crystal. Results are the mean of three to six independent experiments. * marks p < 0.05 when comparing to CT group. (E) Clonogenic assay of colon carcinoma cell lines cultured in the presence of specific inhibitors as in (B). Results are representative of three independent experiments.

Figure 2. Human adenocarcinoma cell lines are sensitive to CsA but not FK506 in culture. (A) Colon carcinoma cell lines were cultured in the presence of indicated inhibitors at concentrations depicted in for 96 h and stained with violet crystal. Results are the mean of three to six independent experiments. * marks p < 0.05 when comparing to CT group. (B) Clonogenic assay of colon carcinoma cell lines cultured in the presence of specific inhibitors as in (B). Results are representative of three independent experiments.

Figure 2. Human adenocarcinoma cell lines are sensitive to CsA but not FK506 in culture. (A) Colon carcinoma cell lines were cultured in the presence of indicated inhibitors at concentrations depicted in Figure 1 for 96 h and stained with violet crystal. Results are the mean of three to six independent experiments. * marks p < 0.05 when comparing to CT group. (B) Clonogenic assay of colon carcinoma cell lines cultured in the presence of specific inhibitors as in (B). Results are representative of three independent experiments.

Figure 3. Effect of the combination of drugs in the growth of CACO-2 cells. (A, B and C) CACO-2 cells were cultured for 72 h in the presence of indicated inhibitors at concentrations depicted in each panel. Drugs were combined as noted. Samples were stained with violet crystal to quantify cell growth. Results are the mean of two to three independent experiments. (B) * marks p < 0.05 when comparing the group treated with the same Rapa concentration in the absence of FK506. (C) * marks p < 0.05 when comparing the group treated with the same Rapa concentration in the absence of CsA. (D) Clonogenic assay of CACO-2 cells cultured in the presence of CsA (2 μM), FK506 (2 μM) or Rapa (20 nM) alone or in combination, as depicted in the figure. Results are representative of two independent experiments.
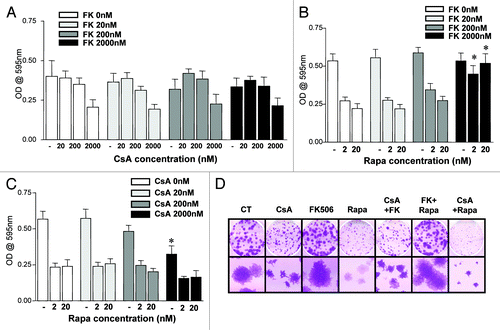
Figure 3. Effect of the combination of drugs in the growth of CACO-2 cells. (A, B and C) CACO-2 cells were cultured for 72 h in the presence of indicated inhibitors at concentrations depicted in each panel. Drugs were combined as noted. Samples were stained with violet crystal to quantify cell growth. Results are the mean of two to three independent experiments. (B) * marks p < 0.05 when comparing the group treated with the same Rapa concentration in the absence of FK506. (C) * marks p < 0.05 when comparing the group treated with the same Rapa concentration in the absence of CsA. (D) Clonogenic assay of CACO-2 cells cultured in the presence of CsA (2 μM), FK506 (2 μM) or Rapa (20 nM) alone or in combination, as depicted in the figure. Results are representative of two independent experiments.

Figure 4. Treatment with CsA and Rapa does not induce cell death but leads to a small delay in cell cycle progression. Analysis of total DNA content of CACO-2 cells cultured in control conditions or treated with CsA (2 μM), FK506 (2 μM) or Rapa (20 nM). At indicated time-points cells were collected and their nuclei DNA content analyzed by propidium iodine (PI) staining and FACS in logarithmic scale to favor SubG0 (A) or in linear scale to favor 2–4 n DNA content analysis (B). Data are representative of six independent experiments.
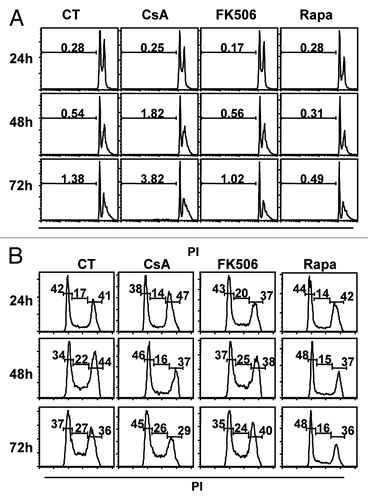
Figure 4. Treatment with CsA and Rapa does not induce cell death but leads to a small delay in cell cycle progression. Analysis of total DNA content of CACO-2 cells cultured in control conditions or treated with CsA (2 μM), FK506 (2 μM) or Rapa (20 nM). At indicated time-points cells were collected and their nuclei DNA content analyzed by propidium iodine (PI) staining and FACS in logarithmic scale to favor SubG0 (A) or in linear scale to favor 2–4 n DNA content analysis (B). Data are representative of six independent experiments.

Figure 5. Arrest in cell proliferation following CsA treatment is not due to TGFβ production. (A) CACO-2 cells were cultured in control conditions or treated with CsA (2 μM) or FK506 (2 μM) for 96 h in culture, the supernatant was collected and hLAP quantified by ELISA. Results are the mean of seven independent experiments. (B) CACO-2 cells were cultured in control conditions, treated with CsA (2 μM) alone or in the presence of 10 μg/ml of αTGFβ for 72 h in culture, fixed and stained with violet crystal. Results are the mean of three independent experiments. * marks p < 0.05 when compared with CT group.
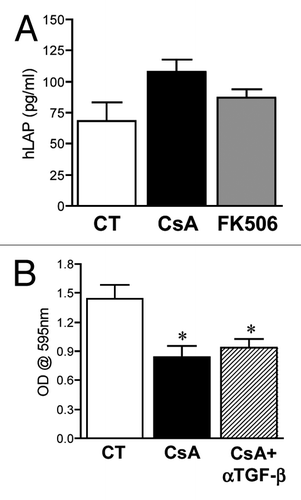
Figure 5. Arrest in cell proliferation following CsA treatment is not due to TGFβ production. (A) CACO-2 cells were cultured in control conditions or treated with CsA (2 μM) or FK506 (2 μM) for 96 h in culture, the supernatant was collected and hLAP quantified by ELISA. Results are the mean of seven independent experiments. (B) CACO-2 cells were cultured in control conditions, treated with CsA (2 μM) alone or in the presence of 10 μg/ml of αTGFβ for 72 h in culture, fixed and stained with violet crystal. Results are the mean of three independent experiments. * marks p < 0.05 when compared with CT group.

Figure 6. Treatment with CsA induces necroptosis. (A) CACO-2 cells were treated with vehicle, CsA, FK506, Rapa or a combination of CsA and Nec-1 as depicted in the figure for 48h. Data are the average of four independent experiments. (B) CACO-2 cells were cultured in the presence of drugs as described in A for 4 d. At each time point samples were trypsinized and counted (upper panel) or fixed and stained with violet crystal (lower panel). Results are the mean of three independent experiments. * marks p < 0.05 when comparing to group treated only with CsA, in the absence of Nec-1.
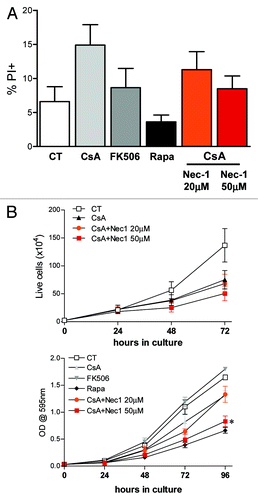
Figure 6. Treatment with CsA induces necroptosis. (A) CACO-2 cells were treated with vehicle, CsA, FK506, Rapa or a combination of CsA and Nec-1 as depicted in the figure for 48h. Data are the average of four independent experiments. (B) CACO-2 cells were cultured in the presence of drugs as described in A for 4 d. At each time point samples were trypsinized and counted (upper panel) or fixed and stained with violet crystal (lower panel). Results are the mean of three independent experiments. * marks p < 0.05 when comparing to group treated only with CsA, in the absence of Nec-1.

Figure 7. Altered mitochondrial membrane potential is not the cause of reduced CACO-2 viability. CACO-2 cells were cultured in the presence of vehicle, CsA (2 μM), FK506 (2 μM) or Rapa (20 nM) for 2 d. Control cells were then treated with the respiratory chain uncoupler FCCP or the ATP synthase inhibitor Oligomycin (Olig) for 15 min. All samples were stained with the fluorescent dye TMRE and analyzed by FACS. Results are the average of two independent experiments. * marks p < 0.05 when comparing to CT group.
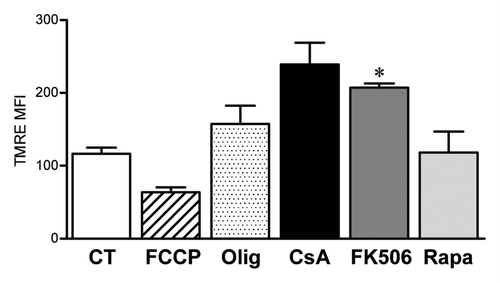
Figure 7. Altered mitochondrial membrane potential is not the cause of reduced CACO-2 viability. CACO-2 cells were cultured in the presence of vehicle, CsA (2 μM), FK506 (2 μM) or Rapa (20 nM) for 2 d. Control cells were then treated with the respiratory chain uncoupler FCCP or the ATP synthase inhibitor Oligomycin (Olig) for 15 min. All samples were stained with the fluorescent dye TMRE and analyzed by FACS. Results are the average of two independent experiments. * marks p < 0.05 when comparing to CT group.

Figure 8. Efficient inhibition of NFAT1 activation by CsA and FK506. (A) CACO-2 cells were treated with inhibitors at concentrations depicted for 30 min at 37°C. Cells were then kept unstimulated as control (CT) or stimulated with 2 μM of Iono for 3 min, lysed and the total protein extract was analyzed by SDS-PAGE. Western blot for NFAT1 followed. (B) CACO-2 cells were transfected with pGL4.30-NFAT-Luc and pRL-TK, and treated with CsA (2 μM), FK506 (2 μM) or Rapa (20 nM) for 24 h. Cells were stimulated for the last 6 h of culture with PMA (20 nM) and Iono (2 μM), lysed and luciferase activity was measured. Results are the mean of four independent experiments. * marks p < 0.05 when comparing to unstimulated group. (C) CACO-2 cells were transfected with pGL4.30-NFAT-Luc and pRL-TK, with or without pEGFP-VIVIT. Starting at 24 h after transfection (0 h), cells were stimulated for the last 6 h of culture with PMA (20 nM) and Iono (2 μM), lysed and luciferase activity was measured. Data represents the average of two independent experiments. (D) CACO-2 cells were transfected with pEGFP-VIVIT or mock-treated. Twenty-four hours after transfection cells were replated, and growth was analyzed by staining with violet crystal. Results are the mean of five independent experiments.
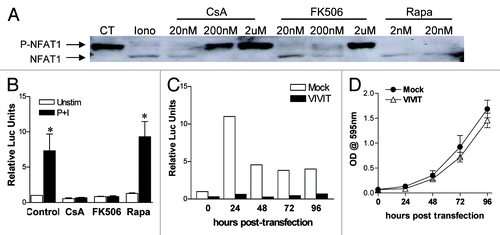
Figure 8. Efficient inhibition of NFAT1 activation by CsA and FK506. (A) CACO-2 cells were treated with inhibitors at concentrations depicted for 30 min at 37°C. Cells were then kept unstimulated as control (CT) or stimulated with 2 μM of Iono for 3 min, lysed and the total protein extract was analyzed by SDS-PAGE. Western blot for NFAT1 followed. (B) CACO-2 cells were transfected with pGL4.30-NFAT-Luc and pRL-TK, and treated with CsA (2 μM), FK506 (2 μM) or Rapa (20 nM) for 24 h. Cells were stimulated for the last 6 h of culture with PMA (20 nM) and Iono (2 μM), lysed and luciferase activity was measured. Results are the mean of four independent experiments. * marks p < 0.05 when comparing to unstimulated group. (C) CACO-2 cells were transfected with pGL4.30-NFAT-Luc and pRL-TK, with or without pEGFP-VIVIT. Starting at 24 h after transfection (0 h), cells were stimulated for the last 6 h of culture with PMA (20 nM) and Iono (2 μM), lysed and luciferase activity was measured. Data represents the average of two independent experiments. (D) CACO-2 cells were transfected with pEGFP-VIVIT or mock-treated. Twenty-four hours after transfection cells were replated, and growth was analyzed by staining with violet crystal. Results are the mean of five independent experiments.

Figure 9. CsA blockade of CACO-2 cell growth is not mediated by altered NFκB activity. CACO-2 cells were transfected with pGL3–6xNFκB-Luc and pRL-TK. Twenty-four hours after transfection, cells were treated overnight with CsA (2 μM), FK506 (2 μM), Rapa (20 nM), Ly294002 (30 μM) or MG132 (20 μM). Cells were stimulated for the last 6 h of culture with PMA (20 nM), lysed and luciferase activity was measured. Results are the mean of two independent experiments. * marks p < 0.05 when comparing to unstimulated group.
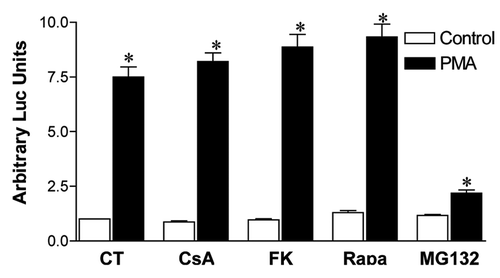
Figure 9. CsA blockade of CACO-2 cell growth is not mediated by altered NFκB activity. CACO-2 cells were transfected with pGL3–6xNFκB-Luc and pRL-TK. Twenty-four hours after transfection, cells were treated overnight with CsA (2 μM), FK506 (2 μM), Rapa (20 nM), Ly294002 (30 μM) or MG132 (20 μM). Cells were stimulated for the last 6 h of culture with PMA (20 nM), lysed and luciferase activity was measured. Results are the mean of two independent experiments. * marks p < 0.05 when comparing to unstimulated group.

Figure 10. CsA is not altering signaling via the PI-3K/mTOR pathway. (A) Colon carcinoma cell lines were cultured in the presence of Rapa (20 nM) or Ly294002 (30 μM) for 96 h and stained with violet crystal. Results are the mean of three to six independent experiments. * marks p < 0.05 when comparing to CT group. (B) Clonogenic assay of colon carcinoma cell lines cultured in the presence of specific inhibitors as in panel A. Results are representative of three independent experiments. (C) Colon carcinoma cell lines were plated, followed by overnight culture without serum. Cells were left untreated or received CsA (2 μM), FK506 (2 μM), Rapa (20 nM) or Ly294002 (30 μM) 30 min prior to addition of 10% FBS. Control cells were left without treatment or stimulation (NS). Cells were then lysed, and the total protein extract was analyzed by SDS-PAGE. Western blot for p70S6K and GAPDH followed.
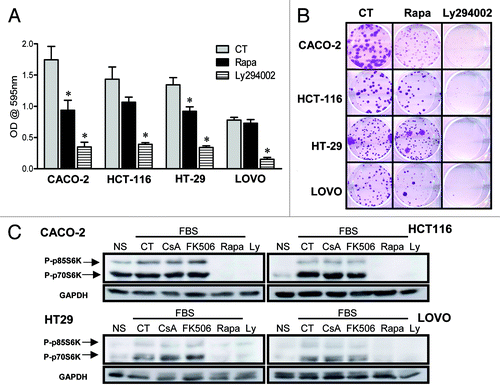
Figure 10. CsA is not altering signaling via the PI-3K/mTOR pathway. (A) Colon carcinoma cell lines were cultured in the presence of Rapa (20 nM) or Ly294002 (30 μM) for 96 h and stained with violet crystal. Results are the mean of three to six independent experiments. * marks p < 0.05 when comparing to CT group. (B) Clonogenic assay of colon carcinoma cell lines cultured in the presence of specific inhibitors as in panel A. Results are representative of three independent experiments. (C) Colon carcinoma cell lines were plated, followed by overnight culture without serum. Cells were left untreated or received CsA (2 μM), FK506 (2 μM), Rapa (20 nM) or Ly294002 (30 μM) 30 min prior to addition of 10% FBS. Control cells were left without treatment or stimulation (NS). Cells were then lysed, and the total protein extract was analyzed by SDS-PAGE. Western blot for p70S6K and GAPDH followed.

Figure 11. Differential susceptibility of human cell lines to CsA treatment in vitro. (A) Not-transformed human cell lines of esophagus and lung were cultured in control conditions or treated with CsA or FK506 (2 μM) for 96 h, when they were fixed and stained with violet crystal. Results are the mean of three to five independent experiments. (B) Human esophagus adenocarcinoma cell lines were treated as in (A). Results are the mean of three to five independent experiments. * marks p < 0.05 when comparing to CT group. (C) Human breast adenocarcinoma cell lines were treated as in (A). Results are the mean of three to five independent experiments. * marks p < 0.05 when comparing to CT group.
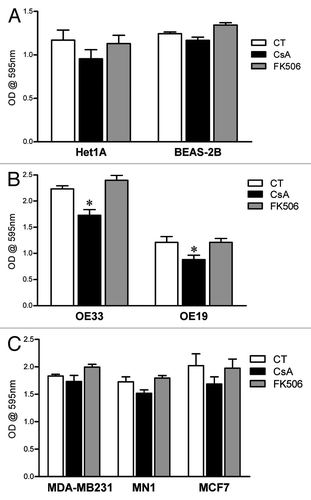
Figure 11. Differential susceptibility of human cell lines to CsA treatment in vitro. (A) Not-transformed human cell lines of esophagus and lung were cultured in control conditions or treated with CsA or FK506 (2 μM) for 96 h, when they were fixed and stained with violet crystal. Results are the mean of three to five independent experiments. (B) Human esophagus adenocarcinoma cell lines were treated as in (A). Results are the mean of three to five independent experiments. * marks p < 0.05 when comparing to CT group. (C) Human breast adenocarcinoma cell lines were treated as in (A). Results are the mean of three to five independent experiments. * marks p < 0.05 when comparing to CT group.

Reprints and Corporate Permissions

Please note: Selecting permissions does not provide access to the full text of the article, please see our help page How do I view content?

To request a reprint or corporate permissions for this article, please click on the relevant link below:

Academic Permissions

Please note: Selecting permissions does not provide access to the full text of the article, please see our help page How do I view content?

Obtain permissions instantly via Rightslink by clicking on the button below:

If you are unable to obtain permissions via Rightslink, please complete and submit this Permissions form. For more information, please visit our Permissions help page.