756
Views
24
CrossRef citations to date
0
Altmetric
Report

Tissue-specific expression of p73 C-terminal isoforms in mice

, , , &
Pages 4474-4483 | Published online: 16 Nov 2012

Figures & data

Figure 1. C-terminal isoforms of p73. (A) Schematic representation of splicing of human C-terminal p73. (B) RNA from kidney of adult mouse was reversed transcribed and cDNA was amplified by PCR. Product was run on 10% acrylamide gel. All the isoforms identified in human were detected and distinguished for different nucleotide length. (C) cDNA derived from an adult mouse was also amplified using isoforms-specific primers for each specific splicing variants. PCR products were run on agarose gel. All experiments have been repeated at least three times. Ctrl, control (DNase RNase-free H2O).
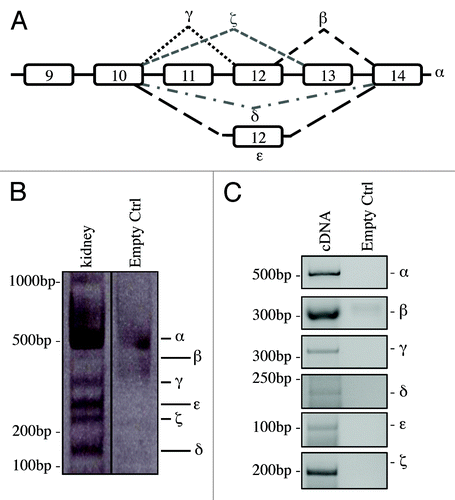
Figure 1. C-terminal isoforms of p73. (A) Schematic representation of splicing of human C-terminal p73. (B) RNA from kidney of adult mouse was reversed transcribed and cDNA was amplified by PCR. Product was run on 10% acrylamide gel. All the isoforms identified in human were detected and distinguished for different nucleotide length. (C) cDNA derived from an adult mouse was also amplified using isoforms-specific primers for each specific splicing variants. PCR products were run on agarose gel. All experiments have been repeated at least three times. Ctrl, control (DNase RNase-free H2O).

Figure 2. Organs-specific expression of p73 C-terminal isoforms. Screening of the isoform expression in organs of 2-mo-old mice. RT-PCR was performed using primers that amplify all isoforms (exons 10–14, mp73-X10 FWD and mp73-X14 REV). Samples were analyzed as in , and representative result is depicted. Experiments have been reproduced at least three times. Olfac. Bulb, olfactory bulb; ctrl, control.

Figure 2. Organs-specific expression of p73 C-terminal isoforms. Screening of the isoform expression in organs of 2-mo-old mice. RT-PCR was performed using primers that amplify all isoforms (exons 10–14, mp73-X10 FWD and mp73-X14 REV). Samples were analyzed as in Figure 1B, and representative result is depicted. Experiments have been reproduced at least three times. Olfac. Bulb, olfactory bulb; ctrl, control.

Figure 3. Expression of C-terminal isoforms during mouse development. Screening of the isoform expression during mouse development starting from embryonic stage E12, reaching adult (2 mo) age. Samples were analyzed as in and a representative result is depicted in (A). Semi-quantitative RT-PCR (30 cycles for C-terminal p73, 20 cycles for GAPDH) was performed and samples were run on a 10% acrylamide gel. Densitometry analysis was performed on at least three gels in order to quantify C-terminal isoforms levels (B) or TAp73 and ΔNp73 levels (C). Experiments have been repeated at least three times. E, embryonic stage; P7, seventh day after birth; TA, TAp73; Δn, ΔNp73; GAPDH, glyceraldehyde 3-phosphate dehydrogenase.
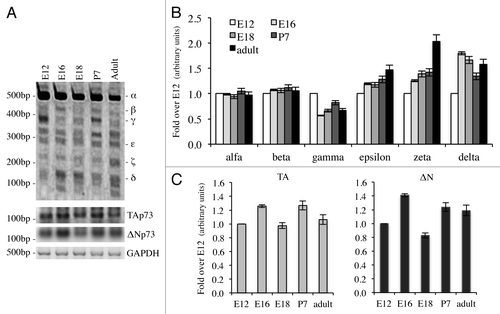
Figure 3. Expression of C-terminal isoforms during mouse development. Screening of the isoform expression during mouse development starting from embryonic stage E12, reaching adult (2 mo) age. Samples were analyzed as in Figure 1B and a representative result is depicted in (A). Semi-quantitative RT-PCR (30 cycles for C-terminal p73, 20 cycles for GAPDH) was performed and samples were run on a 10% acrylamide gel. Densitometry analysis was performed on at least three gels in order to quantify C-terminal isoforms levels (B) or TAp73 and ΔNp73 levels (C). Experiments have been repeated at least three times. E, embryonic stage; P7, seventh day after birth; TA, TAp73; Δn, ΔNp73; GAPDH, glyceraldehyde 3-phosphate dehydrogenase.

Figure 4. C-terminal isoform expression upon DNA damage in vitro. N2a (neuroblastoma cell line) were treated with 1 μg/ml etoposide or 5 μg/ml cisplatin, collected at the indicated time points and processed. Semi-quantitative RT-PCR (30 cycles for C-terminal p73, 20 cycles for GAPDH) was performed, and samples were run on a 10% acrylamide gel. A representative example (of at least three experiments) is depicted in (A). Densitometry analysis of at least three gels was achieved, relative to untreated cells, upon cisplatin treatment (B) or etoposide treatment (C). Cispl, cisplatin; Eto, etoposide; untr., untreated; GAPDH, glyceraldehyde 3-phosphate dehydrogenase.
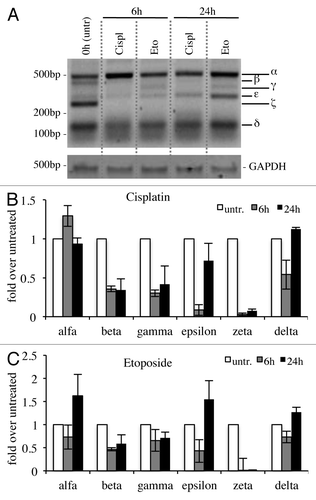
Figure 4. C-terminal isoform expression upon DNA damage in vitro. N2a (neuroblastoma cell line) were treated with 1 μg/ml etoposide or 5 μg/ml cisplatin, collected at the indicated time points and processed. Semi-quantitative RT-PCR (30 cycles for C-terminal p73, 20 cycles for GAPDH) was performed, and samples were run on a 10% acrylamide gel. A representative example (of at least three experiments) is depicted in (A). Densitometry analysis of at least three gels was achieved, relative to untreated cells, upon cisplatin treatment (B) or etoposide treatment (C). Cispl, cisplatin; Eto, etoposide; untr., untreated; GAPDH, glyceraldehyde 3-phosphate dehydrogenase.

Figure 5. C-terminal isoforms expression upon DNA damage in primary splenocytes. Primary splenocytes were treated with 1 μg/ml etoposide or 5 μg/ml cisplatin, collected at the indicated time points and processed. Semi-quantitative RT-PCR (30 cycles for C-terminal p73, 20 cycles for GAPDH) was performed and samples were run on a 10% acrylamide gel. Representative result is depicted in (A). Densitometry analysis of at least three blots was achieved, relative to starting point (untreated, 6 h), to monitor C-terminal isoforms levels (B), TAp73 levels (C) and ΔNp73 levels (D) over time. Cispl, cisplatin; Eto, etoposide; untr., untreated; TA, TAp73; Δn, ΔNp73; GAPDH, glyceraldehyde 3-phosphate dehydrogenase.
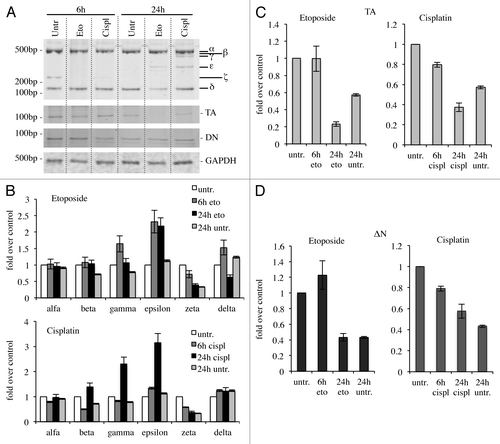
Figure 5. C-terminal isoforms expression upon DNA damage in primary splenocytes. Primary splenocytes were treated with 1 μg/ml etoposide or 5 μg/ml cisplatin, collected at the indicated time points and processed. Semi-quantitative RT-PCR (30 cycles for C-terminal p73, 20 cycles for GAPDH) was performed and samples were run on a 10% acrylamide gel. Representative result is depicted in (A). Densitometry analysis of at least three blots was achieved, relative to starting point (untreated, 6 h), to monitor C-terminal isoforms levels (B), TAp73 levels (C) and ΔNp73 levels (D) over time. Cispl, cisplatin; Eto, etoposide; untr., untreated; TA, TAp73; Δn, ΔNp73; GAPDH, glyceraldehyde 3-phosphate dehydrogenase.
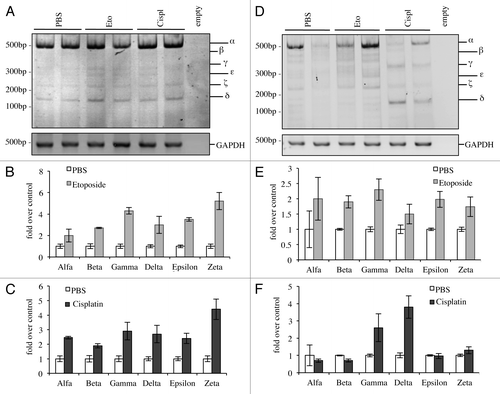
Figure 6. C-terminal isoforms expression upon DNA damage in vivo. C57Bl/6 mice (2-mo-old, n ≥ 6 per group) were treated i.p. with 10 mg/kg etoposide or 5 mg/kg cisplatin or with PBS (control group). Animals were sacrificed after 20 h and tissues were then processed. Semi-quantitative RT-PCR (24 cycles for C-terminal p73, 20 cycles for GAPDH) was performed and samples were run on a 10% acrylamide gel. Example of results deriving from lung is depicted in (A). Densitometry analysis of at least three blots was achieved, showing levels of C-terminal isoforms upon etoposide (B) or cisplatin treatment (C). The same was done for the spleen (D) and quantification upon etoposide (E) or cisplatin (F) is shown. Cispl, cisplatin; Eto, etoposide; untr., untreated; TA, TAp73; Δn, ΔNp73; GAPDH, glyceraldehyde 3-phosphate dehydrogenase.

Figure 6. C-terminal isoforms expression upon DNA damage in vivo. C57Bl/6 mice (2-mo-old, n ≥ 6 per group) were treated i.p. with 10 mg/kg etoposide or 5 mg/kg cisplatin or with PBS (control group). Animals were sacrificed after 20 h and tissues were then processed. Semi-quantitative RT-PCR (24 cycles for C-terminal p73, 20 cycles for GAPDH) was performed and samples were run on a 10% acrylamide gel. Example of results deriving from lung is depicted in (A). Densitometry analysis of at least three blots was achieved, showing levels of C-terminal isoforms upon etoposide (B) or cisplatin treatment (C). The same was done for the spleen (D) and quantification upon etoposide (E) or cisplatin (F) is shown. Cispl, cisplatin; Eto, etoposide; untr., untreated; TA, TAp73; Δn, ΔNp73; GAPDH, glyceraldehyde 3-phosphate dehydrogenase.
Supplemental material

Additional material

Download Zip (5.3 MB)