894
Views
18
CrossRef citations to date
0
Altmetric
Report

Combination of a selective activator of the glucocorticoid receptor Compound A with a proteasome inhibitor as a novel strategy for chemotherapy of hematologic malignancies

, , , , , , , & show all
Pages 133-144 | Published online: 19 Dec 2012

Figures & data

Figure 1. Expression and function of GR in leukemia and lymphoma cell lines. (A) Expression of GR in leukemia and lymphoma cells was determined in untreated cells by western blot analysis of whole-cell lysates. Membranes were probed with anti-actin antibodies to verify equal protein loading and transfer. Image digitizing and quantitative analysis of GR: actin normalized expression was performed by the Odyssey v 1.2 software. (B) Cells were treated with solvent (Control) or Dex for 24 h, and GR nuclear translocation was determined by western blot analysis of nuclear proteins. Membranes were probed with anti-HDAC-1 antibodies to verify equal protein loading and transfer. (C) Cells were treated with solvent (Control) or Dex for 48 h, and effect on cell growth was estimated by cell counting. * Statistically significant differences (p < 0.05) between Dex- and solvent-treated cells. (D) Generation of cells with GR knockout. Cells were infected with shGR- or empty vector-expressing lentiviruses. Expression of GR in CEM-shEV, CEM-shGR, NCEB-shEV and NCEB-shGR cells was determined by western blot analysis of whole-cell lysates. Membranes were probed with anti-actin antibodies to verify equal protein loading.
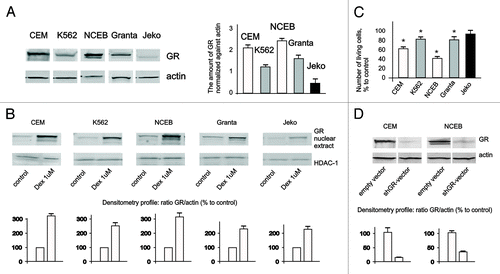
Figure 1. Expression and function of GR in leukemia and lymphoma cell lines. (A) Expression of GR in leukemia and lymphoma cells was determined in untreated cells by western blot analysis of whole-cell lysates. Membranes were probed with anti-actin antibodies to verify equal protein loading and transfer. Image digitizing and quantitative analysis of GR: actin normalized expression was performed by the Odyssey v 1.2 software. (B) Cells were treated with solvent (Control) or Dex for 24 h, and GR nuclear translocation was determined by western blot analysis of nuclear proteins. Membranes were probed with anti-HDAC-1 antibodies to verify equal protein loading and transfer. (C) Cells were treated with solvent (Control) or Dex for 48 h, and effect on cell growth was estimated by cell counting. * Statistically significant differences (p < 0.05) between Dex- and solvent-treated cells. (D) Generation of cells with GR knockout. Cells were infected with shGR- or empty vector-expressing lentiviruses. Expression of GR in CEM-shEV, CEM-shGR, NCEB-shEV and NCEB-shGR cells was determined by western blot analysis of whole-cell lysates. Membranes were probed with anti-actin antibodies to verify equal protein loading.

Figure 2. Cytotoxic effect of CpdA in transformed lymphoid cell lines and primary leukemia patient cells. CEM-shEV, CEM-shGR, NCEB-shEV and NCEB-shGR were treated with solvent (control), Dex or CpdA for 48 h, and the effect on cell growth (A) was estimated by cell counting. The effect on apoptosis (B) was determined by flow cytometry using propidium iodide staining (the amount of cells in sub-G1-phase was calculated as percentage to all cells in sample) and by western blot analysis of cleaved PARP level. Membranes were probed with anti-HDAC-1 antibodies to verify the equal protein loading. Image digitizing and quantitative analysis of GR:HDAC-1 normalized expression were performed by the Odyssey v1.2 software. (C) Primary leukemia cells from four different T-ALL patients at acute stage of disease were treated with solvent (Control), Dex and CpdA for 48 h, and the growth was estimated by cell counting. (A–C) *Statistically significant differences (p < 0.05)—between Dex (or CpdA)—and solvent-treated cells. Note: (1) Effect of both GR ligands CpdA and Dex on transformed lymphoma cells growth depends on GR; (2) CpdA and Dex induced comparable cytoxic effect in primary T-ALL patient cells.
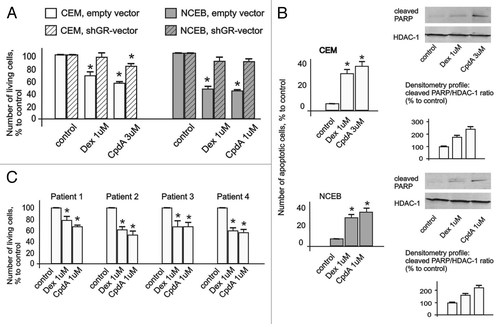
Figure 2. Cytotoxic effect of CpdA in transformed lymphoid cell lines and primary leukemia patient cells. CEM-shEV, CEM-shGR, NCEB-shEV and NCEB-shGR were treated with solvent (control), Dex or CpdA for 48 h, and the effect on cell growth (A) was estimated by cell counting. The effect on apoptosis (B) was determined by flow cytometry using propidium iodide staining (the amount of cells in sub-G1-phase was calculated as percentage to all cells in sample) and by western blot analysis of cleaved PARP level. Membranes were probed with anti-HDAC-1 antibodies to verify the equal protein loading. Image digitizing and quantitative analysis of GR:HDAC-1 normalized expression were performed by the Odyssey v1.2 software. (C) Primary leukemia cells from four different T-ALL patients at acute stage of disease were treated with solvent (Control), Dex and CpdA for 48 h, and the growth was estimated by cell counting. (A–C) *Statistically significant differences (p < 0.05)—between Dex (or CpdA)—and solvent-treated cells. Note: (1) Effect of both GR ligands CpdA and Dex on transformed lymphoma cells growth depends on GR; (2) CpdA and Dex induced comparable cytoxic effect in primary T-ALL patient cells.

Figure 3. CpdA does not affect GR transactivation but induces GR transrepression in transformed lymphoid cells. CEM and NCEB cells stably infected with lentiviruses expressing luciferase reporters GRE.Luc (A), NFkB.Luc or AP1.Luc cells (B) were incubated for 8 h with solvent (Control), Dex or CpdA. Luciferase activity was determined as described in “Materials and Methods.” Statistically significant difference (*p < 0.05; ** p < 0.01) between Dex (or CpdA)- and solvent-treated cells.
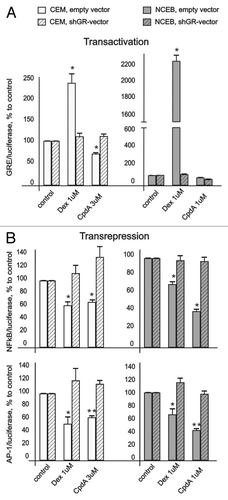
Figure 3. CpdA does not affect GR transactivation but induces GR transrepression in transformed lymphoid cells. CEM and NCEB cells stably infected with lentiviruses expressing luciferase reporters GRE.Luc (A), NFkB.Luc or AP1.Luc cells (B) were incubated for 8 h with solvent (Control), Dex or CpdA. Luciferase activity was determined as described in “Materials and Methods.” Statistically significant difference (*p < 0.05; ** p < 0.01) between Dex (or CpdA)- and solvent-treated cells.

Figure 4. CpdA does not induce cell desensitization. Cells were treated with solvent (control), Dex and CpdA for 24 h. The expression of GR and FKBP51 was analyzed by western blotting of whole cell protein extracts (A), and by SQ-RT-PCR (B). To verify equal loading and adequate transfer in western blot analysis, the membranes were probed with anti-actin antibodies. Amounts of PCR-products were normalized to the amount of GAPDH PCR-product.
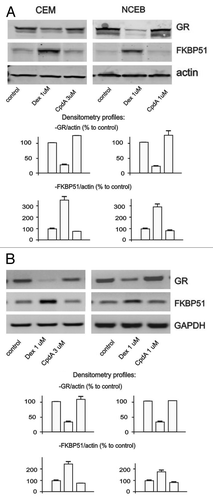
Figure 4. CpdA does not induce cell desensitization. Cells were treated with solvent (control), Dex and CpdA for 24 h. The expression of GR and FKBP51 was analyzed by western blotting of whole cell protein extracts (A), and by SQ-RT-PCR (B). To verify equal loading and adequate transfer in western blot analysis, the membranes were probed with anti-actin antibodies. Amounts of PCR-products were normalized to the amount of GAPDH PCR-product.

Figure 5. Bortezomib induced GR accumulation, and enhanced CpdA properties as “dissociated” GR ligand. CEM and NCEB cells stably infected with lentiviruses expressing luciferase reporters: GRE.Luc (A), NFkB.Luc or AP1.Luc cells (B) were incubated for 8 h with solvent (control), Bortezomib (BZ), CpdA or BZ + CpdA. Luciferase activity was determined as described in “Materials and Methods.” Statistically significant difference (*p < 0.05; ** p < 0.01) between treated- and control cells; # statistically significant difference (p < 0.05) between CpdA and BZ+CpdA. (C). Cells were incubated for 8 h with BZ or solvent (Control), and GR expression was determined by western blot analysis of whole CEM and NCEB cell extracts. To verify equal loading and adequate transfer, the membranes were probed with anti-actin antibodies.
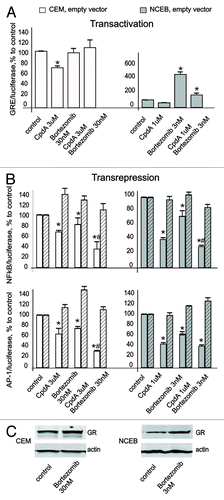
Figure 5. Bortezomib induced GR accumulation, and enhanced CpdA properties as “dissociated” GR ligand. CEM and NCEB cells stably infected with lentiviruses expressing luciferase reporters: GRE.Luc (A), NFkB.Luc or AP1.Luc cells (B) were incubated for 8 h with solvent (control), Bortezomib (BZ), CpdA or BZ + CpdA. Luciferase activity was determined as described in “Materials and Methods.” Statistically significant difference (*p < 0.05; ** p < 0.01) between treated- and control cells; # statistically significant difference (p < 0.05) between CpdA and BZ+CpdA. (C). Cells were incubated for 8 h with BZ or solvent (Control), and GR expression was determined by western blot analysis of whole CEM and NCEB cell extracts. To verify equal loading and adequate transfer, the membranes were probed with anti-actin antibodies.

Figure 6. Cooperative anticancer effect of proteasome inhibitor Bortezomib and CpdA in transformed lymphoid cells. CEM-shEV, CEM-shGR, NCEB-shEV and NCEB-shGR cells were incubated with solvent, CpdA, BZ or CpdA/BZ for 48 h. (A) Cell growth was evaluated by cell counting. (B and C) Apoptosis in CEM and NCEB cells was analyzed by western blot analysis of PARP cleavage (B) and by flow cytometry using propidium iodide staining (C). The number of apoptotic cells was calculated as percentage to all cells in sample (C andD). Number of cells in S-phase was determined by flow cytometry using propidium iodide staining. Statistically significant difference (*p < 0.05; ** p < 0.01) between treated and control cells; #, statistically significant difference (p < 0.05) between CpdA and BZ+CpdA.
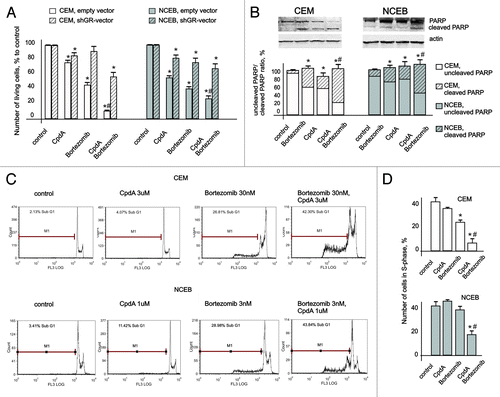
Figure 6. Cooperative anticancer effect of proteasome inhibitor Bortezomib and CpdA in transformed lymphoid cells. CEM-shEV, CEM-shGR, NCEB-shEV and NCEB-shGR cells were incubated with solvent, CpdA, BZ or CpdA/BZ for 48 h. (A) Cell growth was evaluated by cell counting. (B and C) Apoptosis in CEM and NCEB cells was analyzed by western blot analysis of PARP cleavage (B) and by flow cytometry using propidium iodide staining (C). The number of apoptotic cells was calculated as percentage to all cells in sample (C andD). Number of cells in S-phase was determined by flow cytometry using propidium iodide staining. Statistically significant difference (*p < 0.05; ** p < 0.01) between treated and control cells; #, statistically significant difference (p < 0.05) between CpdA and BZ+CpdA.

Figure 7. Cooperative GR-dependent anticancer effect of proteasome-inhibitor Bortezomib and CpdA in multiple myeloma cells. (A) Expression of GR in MM cells. MM1.S, MM1.R and MM.1R-GR cells stably infected with GR-expressing lentivirus was determined by western blot analysis of whole-cell lysates. (B and C) GR-dependent cytotoxic effect of GR ligands FA and CpdA in MM cells. MM1.S and MM1.R, were treated with solvent (control), FA or CpdA for 72 h, and the effect on apoptosis (B) was determined by western blot analysis of PARP cleavage after 36 h of treatment. The effect on cell growth (B) was estimated by cell counting. (D) MM.1S cells are more sensitive to cytotoxic effect of BZ than MM.1R cells. MM cells with different GR status were treated with BZ for 72 h, and the number of cells/well was counted. (E) Cooperative anti-MM effect of CpdA and BZ depends on GR. MM.1R and MM.1S cells were incubated with solvent, CpdA, BZ or CpdA/BZ for 72 h. Cell growth was evaluated by cell counting. Apoptosis in MM cells was analyzed by western blot analysis of PARP cleavage. Note: MM.1R cells are resistant and MM.1S and MM.1R-GR cells are sensitive to cytotoxic and cytostatic effect of CpdA and FA.
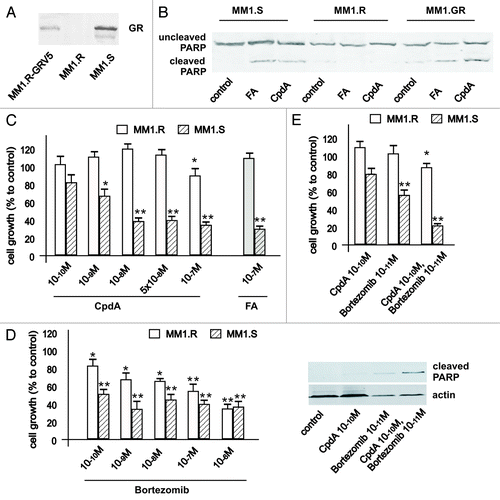
Figure 7. Cooperative GR-dependent anticancer effect of proteasome-inhibitor Bortezomib and CpdA in multiple myeloma cells. (A) Expression of GR in MM cells. MM1.S, MM1.R and MM.1R-GR cells stably infected with GR-expressing lentivirus was determined by western blot analysis of whole-cell lysates. (B and C) GR-dependent cytotoxic effect of GR ligands FA and CpdA in MM cells. MM1.S and MM1.R, were treated with solvent (control), FA or CpdA for 72 h, and the effect on apoptosis (B) was determined by western blot analysis of PARP cleavage after 36 h of treatment. The effect on cell growth (B) was estimated by cell counting. (D) MM.1S cells are more sensitive to cytotoxic effect of BZ than MM.1R cells. MM cells with different GR status were treated with BZ for 72 h, and the number of cells/well was counted. (E) Cooperative anti-MM effect of CpdA and BZ depends on GR. MM.1R and MM.1S cells were incubated with solvent, CpdA, BZ or CpdA/BZ for 72 h. Cell growth was evaluated by cell counting. Apoptosis in MM cells was analyzed by western blot analysis of PARP cleavage. Note: MM.1R cells are resistant and MM.1S and MM.1R-GR cells are sensitive to cytotoxic and cytostatic effect of CpdA and FA.
Supplemental material

Additional material

Download Zip (340.2 KB)

Reprints and Corporate Permissions

Please note: Selecting permissions does not provide access to the full text of the article, please see our help page How do I view content?

To request a reprint or corporate permissions for this article, please click on the relevant link below:

Academic Permissions

Please note: Selecting permissions does not provide access to the full text of the article, please see our help page How do I view content?

Obtain permissions instantly via Rightslink by clicking on the button below:

If you are unable to obtain permissions via Rightslink, please complete and submit this Permissions form. For more information, please visit our Permissions help page.