2,531
Views
135
CrossRef citations to date
0
Altmetric
Report

Metformin selectively affects human glioblastoma tumor-initiating cell viability

A role for metformin-induced inhibition of Akt

, , , , , , , , , , , , , , & show all
Pages 145-156 | Published online: 19 Dec 2012

Figures & data

Figure 1. Phenotypic characterization of GBM TICs and differentiated cells. Upper pictures: Representative morphological appearance of GBM TICs grown as spheres, monolayers on matrigel or after FBS-dependent differentiation (enlargements 10X). Lower pictures: Expression of TIC (CD133, nestin) or differentiated cell (GFAP, Map2) markers. For spheres, sequential confocal microscopy z-plane sections are reported. The following picture enlargements were used: TIC spheres, 40X; TIC monolayers, 10X; differentiated GBM cells, 10X for top pictures and 100X for middle and lower pictures.
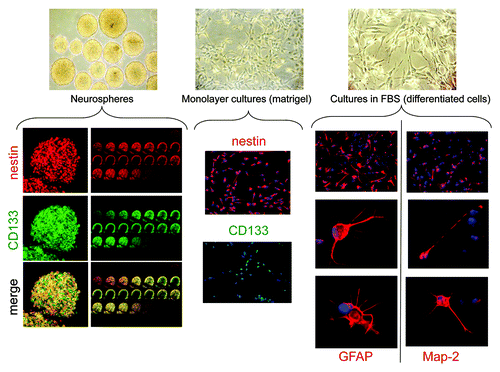
Figure 1. Phenotypic characterization of GBM TICs and differentiated cells. Upper pictures: Representative morphological appearance of GBM TICs grown as spheres, monolayers on matrigel or after FBS-dependent differentiation (enlargements 10X). Lower pictures: Expression of TIC (CD133, nestin) or differentiated cell (GFAP, Map2) markers. For spheres, sequential confocal microscopy z-plane sections are reported. The following picture enlargements were used: TIC spheres, 40X; TIC monolayers, 10X; differentiated GBM cells, 10X for top pictures and 100X for middle and lower pictures.

Figure 2. In vivo tumorigenicity of human GBM TIC cultures. (A) Representative images of tumors developed in NOD/SCID mice orthotopically grafted with TICs from GBM 1–4. After sacrifice of the animals (survival range 80–190 d), brains were fixed and stained with hematoxylin and eosin (H&E), showing that all four TICs initiated high-grade invasive tumors. (B) The tumorigenic potential has been recorded as the percentage of tumor take-rate for each GBM TIC after injection of 10,000 cells. The ratio of mice bearing tumor xenografts and total number of animals used for in vivo experiments is reported in brackets. (C) The percentage of tumor take-rate is dependent from the number of injected TICs. The indicated number of cells of GBM 1 TIC was injected into the brain of NOD/SCID and generated tumors with different take-rate efficiency.
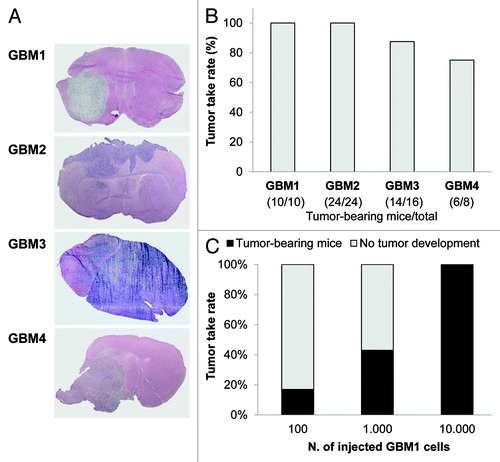
Figure 2. In vivo tumorigenicity of human GBM TIC cultures. (A) Representative images of tumors developed in NOD/SCID mice orthotopically grafted with TICs from GBM 1–4. After sacrifice of the animals (survival range 80–190 d), brains were fixed and stained with hematoxylin and eosin (H&E), showing that all four TICs initiated high-grade invasive tumors. (B) The tumorigenic potential has been recorded as the percentage of tumor take-rate for each GBM TIC after injection of 10,000 cells. The ratio of mice bearing tumor xenografts and total number of animals used for in vivo experiments is reported in brackets. (C) The percentage of tumor take-rate is dependent from the number of injected TICs. The indicated number of cells of GBM 1 TIC was injected into the brain of NOD/SCID and generated tumors with different take-rate efficiency.

Figure 3. Effect of metformin treatment of GBM TIC survival. (A) Metformin inhibits GBM1–4 TIC viability, evaluated using cells grown as spheres (black dots) or as monolayers on matrigel (white dots) by MTT assay. Both culture methods showed similar sensitivity to metformin that induced in all GBM cells a statistically significant inhibition. (p < 0.01 vs. untreated cells reported as 100%, n = 4.) (B) Antiproliferative effects of metformin evaluated as percentage of Ki-67-positive cells in GBM1–4 TIC spheres. White dots represent Ki-67-expressing cells, while gray fluorescence corresponds to DAPI nuclear counterstain. In the upper picture, a representative sphere from GBM1 TICs untreated or metformin-treated (20 mM, 48 h), while in the lower graph, an average of experiments pooling data from all the cultures is reported. (n = 3; ** = p < 0.01 vs. untreated cell.) (C) Cell growth recovery experiments evaluated by MTT assay. GBM1–4 TICs were treated for 48 h with increasing concentrations of metformin (black bars, untreated cells are represented as white bars), followed by 48 h culture in drug-free medium (gray bars). Low metformin concentrations were mainly cytostatic, as shown by cell growth recovery after drug withdrawal, while concentrations higher than the calculated IC50 (about 10 mM) resulted in a cytotoxic effect. (n = 3; * = p < 0.05 and ** = p < 0.01 vs. respective metformin-treated experimental points.)
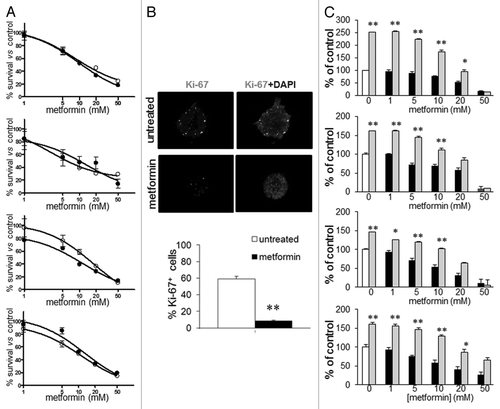
Figure 3. Effect of metformin treatment of GBM TIC survival. (A) Metformin inhibits GBM1–4 TIC viability, evaluated using cells grown as spheres (black dots) or as monolayers on matrigel (white dots) by MTT assay. Both culture methods showed similar sensitivity to metformin that induced in all GBM cells a statistically significant inhibition. (p < 0.01 vs. untreated cells reported as 100%, n = 4.) (B) Antiproliferative effects of metformin evaluated as percentage of Ki-67-positive cells in GBM1–4 TIC spheres. White dots represent Ki-67-expressing cells, while gray fluorescence corresponds to DAPI nuclear counterstain. In the upper picture, a representative sphere from GBM1 TICs untreated or metformin-treated (20 mM, 48 h), while in the lower graph, an average of experiments pooling data from all the cultures is reported. (n = 3; ** = p < 0.01 vs. untreated cell.) (C) Cell growth recovery experiments evaluated by MTT assay. GBM1–4 TICs were treated for 48 h with increasing concentrations of metformin (black bars, untreated cells are represented as white bars), followed by 48 h culture in drug-free medium (gray bars). Low metformin concentrations were mainly cytostatic, as shown by cell growth recovery after drug withdrawal, while concentrations higher than the calculated IC50 (about 10 mM) resulted in a cytotoxic effect. (n = 3; * = p < 0.05 and ** = p < 0.01 vs. respective metformin-treated experimental points.)

Figure 4. Effect of metformin treatment on GBM TIC proliferation rate. GBM1 and GBM3 TIC proliferation rate was tracked by CFSE dye dilution flow cytometry assay. (A) Report a representative generation distribution plot for GBM1 TICs. Each curve represents a new generation that occurred, starting from the blue curve (parental cells). As compared with untreated cells (controls), metformin-treated cells (10 and 20 mM, for 72 h) profile shows a significant reduced number of cell division. (B and C) Report the quantification of the data for GBM1 and GBM3. A clear slow-down of cell division in both GBM TICs is demonstrated by the low number of generations reached in metformin-treated cells. On top of tables (in red) the proliferation indexes (p.i.) are reported, representing the sum of cells in all generations divided by the number of original parent cells.
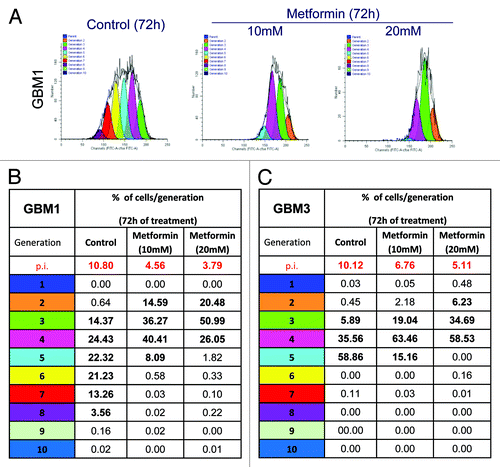
Figure 4. Effect of metformin treatment on GBM TIC proliferation rate. GBM1 and GBM3 TIC proliferation rate was tracked by CFSE dye dilution flow cytometry assay. (A) Report a representative generation distribution plot for GBM1 TICs. Each curve represents a new generation that occurred, starting from the blue curve (parental cells). As compared with untreated cells (controls), metformin-treated cells (10 and 20 mM, for 72 h) profile shows a significant reduced number of cell division. (B and C) Report the quantification of the data for GBM1 and GBM3. A clear slow-down of cell division in both GBM TICs is demonstrated by the low number of generations reached in metformin-treated cells. On top of tables (in red) the proliferation indexes (p.i.) are reported, representing the sum of cells in all generations divided by the number of original parent cells.

Figure 5. Effect of metformin on proliferation of CD133+ GBM TICs. GBM1 and GBM3 TICs were selected for CD133+ cells by FACS, left untreated (control) or treated with metformin (20 mM, 72 h) and analyzed for proliferation rate by CFSE dye dilution. (A) Percentage of CD133+ GBM TICs that did not show reduced fluorescence (parental cells) representing cells that did not divide for all the duration of the experiment. (** = p < 0.01 vs. respective untreated control cells.) (B) Antiproliferative effects of metformin evaluated as Ki-67 expression in GBM1, GBM3 and GBM4 TIC spheres by confocal microscopy IF experiments measuring co-expression of CD133 and Ki-67. Co-localization index was calculated using Laserpix software. In the graph, the average of experiments pooling data from all cultures is reported. (n = 3; ** = p < 0.01 vs. untreated control cells.) (C) Effect of metformin on GBM TIC sphere formation. GBM1, GBM3 and GBM4 TICs were plated and sphere formation allowed for 4 d before treatment with metformin (1–50 mM) for 48 h. Representative pictures of spheres in wells for each culture in control or after metformin treatment are reported on top of the graphs. Data are an average of three independent experiments, measuring eight individual wells for each point and reported as percentage on untreated cells. (* = p < 0.05 and ** = p < 0.01 vs. respective untreated control cells.)
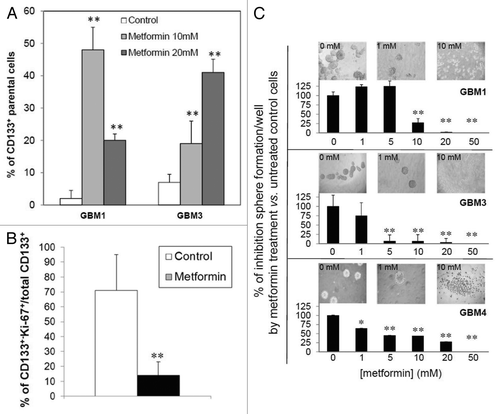
Figure 5. Effect of metformin on proliferation of CD133+ GBM TICs. GBM1 and GBM3 TICs were selected for CD133+ cells by FACS, left untreated (control) or treated with metformin (20 mM, 72 h) and analyzed for proliferation rate by CFSE dye dilution. (A) Percentage of CD133+ GBM TICs that did not show reduced fluorescence (parental cells) representing cells that did not divide for all the duration of the experiment. (** = p < 0.01 vs. respective untreated control cells.) (B) Antiproliferative effects of metformin evaluated as Ki-67 expression in GBM1, GBM3 and GBM4 TIC spheres by confocal microscopy IF experiments measuring co-expression of CD133 and Ki-67. Co-localization index was calculated using Laserpix software. In the graph, the average of experiments pooling data from all cultures is reported. (n = 3; ** = p < 0.01 vs. untreated control cells.) (C) Effect of metformin on GBM TIC sphere formation. GBM1, GBM3 and GBM4 TICs were plated and sphere formation allowed for 4 d before treatment with metformin (1–50 mM) for 48 h. Representative pictures of spheres in wells for each culture in control or after metformin treatment are reported on top of the graphs. Data are an average of three independent experiments, measuring eight individual wells for each point and reported as percentage on untreated cells. (* = p < 0.05 and ** = p < 0.01 vs. respective untreated control cells.)

Figure 6. Differential efficacy of metformin on GBM TIC and differentiated cell survival and glucose uptake; lack of effects on human MSC. (A) Effect of metformin (1–50 mM, 72 h) on survival of GBM TIC (white circles) and differentiated cells (black diamonds) derived from GBM1, GBM3 and GBM4, by MTT assay. While metformin reduced TIC viability (p < 0.01), differentiated cells were only slightly affected (statistically significant effect observed only at 50 mM, p < 0.01). Dotted lines represent the values of untreated control cells, taken as 100%. Data are the average of four replica experiments. (B) Effect of metformin (20 mM, 72 h) on the survival of GBM TICs and differentiated cells derived from GBM1, GBM3 and GBM4, grown in monolayer on matrigel and evaluated by percentage of expression of Ki-67 in IF experiments. Data are reported as percentage of Ki-67+ cells over total cells stained with DAPI. (n = 3; ** = p < 0.01.) (C) (18F)-fluoro-deoxyglucose (FDG) uptake in GBM1 TIC and differentiated cells in basal and metformin-treated (20 mM, 24 h) conditions. While basal FDG uptake was significantly higher in TICs, metformin was able to increase this value only in differentiated GBM cells. Data are means of two independent experiments ± SD. Statistical significances are reported; ns, non-significant. (D) Effect of metformin (72 h) on survival of GBM TICs (black circles) and MSC (white squares), by MTT assay. Lines represent the average of independent experiments performed on GBM1, GBM3 and GBM4 and three individual MSC cultures, repeated three times and pooled together. Dotted lines represent the values of respective untreated control cells, taken as 100%. (** = p < 0.01 vs. respective control values.)
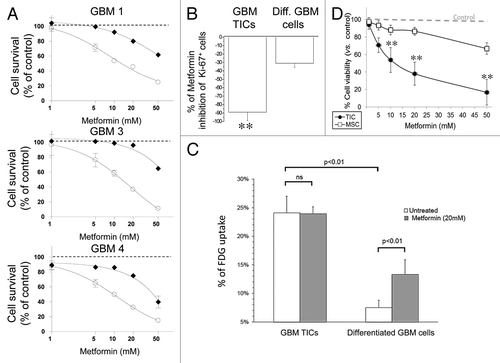
Figure 6. Differential efficacy of metformin on GBM TIC and differentiated cell survival and glucose uptake; lack of effects on human MSC. (A) Effect of metformin (1–50 mM, 72 h) on survival of GBM TIC (white circles) and differentiated cells (black diamonds) derived from GBM1, GBM3 and GBM4, by MTT assay. While metformin reduced TIC viability (p < 0.01), differentiated cells were only slightly affected (statistically significant effect observed only at 50 mM, p < 0.01). Dotted lines represent the values of untreated control cells, taken as 100%. Data are the average of four replica experiments. (B) Effect of metformin (20 mM, 72 h) on the survival of GBM TICs and differentiated cells derived from GBM1, GBM3 and GBM4, grown in monolayer on matrigel and evaluated by percentage of expression of Ki-67 in IF experiments. Data are reported as percentage of Ki-67+ cells over total cells stained with DAPI. (n = 3; ** = p < 0.01.) (C) (18F)-fluoro-deoxyglucose (FDG) uptake in GBM1 TIC and differentiated cells in basal and metformin-treated (20 mM, 24 h) conditions. While basal FDG uptake was significantly higher in TICs, metformin was able to increase this value only in differentiated GBM cells. Data are means of two independent experiments ± SD. Statistical significances are reported; ns, non-significant. (D) Effect of metformin (72 h) on survival of GBM TICs (black circles) and MSC (white squares), by MTT assay. Lines represent the average of independent experiments performed on GBM1, GBM3 and GBM4 and three individual MSC cultures, repeated three times and pooled together. Dotted lines represent the values of respective untreated control cells, taken as 100%. (** = p < 0.01 vs. respective control values.)

Figure 7. Metformin anti-tumor effects on GBM TICs are mediated by inhibition of Akt activation. (A) Effect of metformin (24 h pretreatment) on EGF (40 ng/ml, 5 min) induced Akt phosphorylation. Proteins were normalized for β-tubulin expression. On the left, representative results obtained using GBM1, GBM3 and GBM4 TICs and differentiated cells are reported, while on the right, the same experiment was performed on human MSCs. (B) Densitometric analysis of the data in (A), averaging two distinct experiments and expressed as phospho-Akt/β-tubulin ratio. (** = p < 0.01 vs. respective EGF-treated values.) (C) Effect metformin on mTOR phosphorylation.
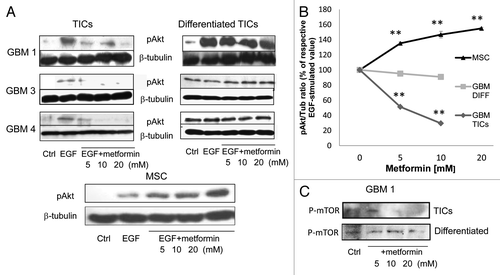
Figure 7. Metformin anti-tumor effects on GBM TICs are mediated by inhibition of Akt activation. (A) Effect of metformin (24 h pretreatment) on EGF (40 ng/ml, 5 min) induced Akt phosphorylation. Proteins were normalized for β-tubulin expression. On the left, representative results obtained using GBM1, GBM3 and GBM4 TICs and differentiated cells are reported, while on the right, the same experiment was performed on human MSCs. (B) Densitometric analysis of the data in (A), averaging two distinct experiments and expressed as phospho-Akt/β-tubulin ratio. (** = p < 0.01 vs. respective EGF-treated values.) (C) Effect metformin on mTOR phosphorylation.

Reprints and Corporate Permissions

Please note: Selecting permissions does not provide access to the full text of the article, please see our help page How do I view content?

To request a reprint or corporate permissions for this article, please click on the relevant link below:

Academic Permissions

Please note: Selecting permissions does not provide access to the full text of the article, please see our help page How do I view content?

Obtain permissions instantly via Rightslink by clicking on the button below:

If you are unable to obtain permissions via Rightslink, please complete and submit this Permissions form. For more information, please visit our Permissions help page.