1,637
Views
15
CrossRef citations to date
0
Altmetric
Report

A high-content cellular senescence screen identifies candidate tumor suppressors, including EPHA3

, , , , , , , & show all
Pages 625-634 | Published online: 16 Jan 2013

Figures & data

Figure 1. Identification of senescence-inducing kinase siRNAs. (A) Schematic overview of the high-content senescence screen. (B) Scatterplot analysis of data from the kinome HCS screen in p53+ cells. Cells were stained for Ki67, p53, p21CIP1 and Hoechst at day 3, and multiparametric analysis was performed to determine siRNAs displaying decreased proliferation (< 0.5 StDev Ki67%) and an increased nuclear size (> 2.0 StDev Hoechst mean area). High, medium and low cell number indicators are assigned as the third parameter. (C) Senescence scores per gene are the sum of the senescence scores of its siRNA pool and the four individual siRNAs, omitting siRNAs conferring less than 50% specific gene knockdown. Scoring details are depicted in Table S2. References to studies establishing bona fide tumor suppressor functions for human (Hs) or mouse (Mm) genes are indicated.
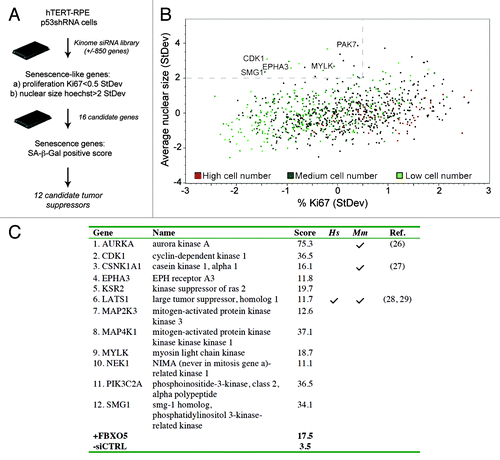
Figure 1. Identification of senescence-inducing kinase siRNAs. (A) Schematic overview of the high-content senescence screen. (B) Scatterplot analysis of data from the kinome HCS screen in p53+ cells. Cells were stained for Ki67, p53, p21CIP1 and Hoechst at day 3, and multiparametric analysis was performed to determine siRNAs displaying decreased proliferation (< 0.5 StDev Ki67%) and an increased nuclear size (> 2.0 StDev Hoechst mean area). High, medium and low cell number indicators are assigned as the third parameter. (C) Senescence scores per gene are the sum of the senescence scores of its siRNA pool and the four individual siRNAs, omitting siRNAs conferring less than 50% specific gene knockdown. Scoring details are depicted in Table S2. References to studies establishing bona fide tumor suppressor functions for human (Hs) or mouse (Mm) genes are indicated.

Figure 2. Delineation of senescence signatures. (A) hTERT-RPE1 p53 shRNA cells were transfected with kinome siRNAs in the absence of doxycycline and immunostained for p53 and p21CIP1 following 72 h culture. Percentages of cells expressing p53, p21CIP1 above threshold levels were calculated, and averages from four 384 wells are shown. (B) hTERT-RPE1 p53 shRNA cells were transfected with kinome siRNAs in the absence or presence of doxycycline and immunostained for Ki67. Percentages of cells expressing Ki67 protein above threshold levels were calculated, and averages from four 384 wells are shown. * indicates p ≤ 0,05 and ** indicates p ≤ 0,01. (C) Senescence scores per gene are the sum of the senescence scores of the siRNA pool plus four individual siRNAs, omitting siRNAs conferring less than 50% knockdown. Detailed scoring information is depicted in Table S3. (D) Quantitative p16INK4A mRNA expression analyses during senescence induction. hTERT-RPE1 p53 shRNA cells were transfected with pooled siRNAs in the absence of doxycycline. RNA expression was quantitated using TaqMan analyses after 3 days of transfection. (E) Schematic model summarizing kinome screen data, using data depicted in (A) and (D). In an incipient tumor, modeled by hTERT-RPE1 cells, loss of selected tumor suppressors activates p53- and/or p16INK4A-dependent senescence, and overt DNA damage. In a premalignant tumor, senescence may serve as a cell-intrinsic tumor suppressor mechanism to subvert oncogenic transformation. Loss of p16INK4A and/or p53 promotes malignancy.
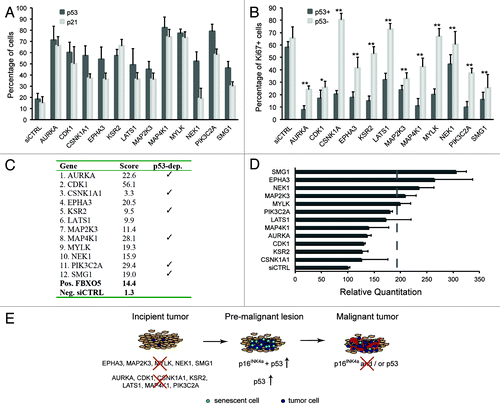
Figure 2. Delineation of senescence signatures. (A) hTERT-RPE1 p53 shRNA cells were transfected with kinome siRNAs in the absence of doxycycline and immunostained for p53 and p21CIP1 following 72 h culture. Percentages of cells expressing p53, p21CIP1 above threshold levels were calculated, and averages from four 384 wells are shown. (B) hTERT-RPE1 p53 shRNA cells were transfected with kinome siRNAs in the absence or presence of doxycycline and immunostained for Ki67. Percentages of cells expressing Ki67 protein above threshold levels were calculated, and averages from four 384 wells are shown. * indicates p ≤ 0,05 and ** indicates p ≤ 0,01. (C) Senescence scores per gene are the sum of the senescence scores of the siRNA pool plus four individual siRNAs, omitting siRNAs conferring less than 50% knockdown. Detailed scoring information is depicted in Table S3. (D) Quantitative p16INK4A mRNA expression analyses during senescence induction. hTERT-RPE1 p53 shRNA cells were transfected with pooled siRNAs in the absence of doxycycline. RNA expression was quantitated using TaqMan analyses after 3 days of transfection. (E) Schematic model summarizing kinome screen data, using data depicted in (A) and (D). In an incipient tumor, modeled by hTERT-RPE1 cells, loss of selected tumor suppressors activates p53- and/or p16INK4A-dependent senescence, and overt DNA damage. In a premalignant tumor, senescence may serve as a cell-intrinsic tumor suppressor mechanism to subvert oncogenic transformation. Loss of p16INK4A and/or p53 promotes malignancy.

Figure 3. Senescence gene loss evidenced by genomic copy number analysis. Heatmap clustering analysis of SNP array-CGH data from 2654 samples from 53 panels of human tumors and cell lines, to identify sets with a genome copy number lower than 1.5. A sliding scale density gradient was applied. Loci encompassing tumor suppressors CDKN2A, RB1, TP53 and VHL were included as positive controls and oncogenes CCND1, ERBB2, MDM2 and MYC as negative controls. Stars indicate genes closely resembling the tumor suppressor signature.
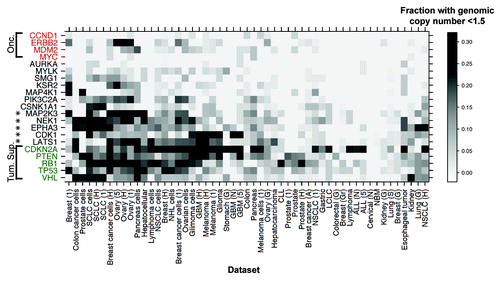
Figure 3. Senescence gene loss evidenced by genomic copy number analysis. Heatmap clustering analysis of SNP array-CGH data from 2654 samples from 53 panels of human tumors and cell lines, to identify sets with a genome copy number lower than 1.5. A sliding scale density gradient was applied. Loci encompassing tumor suppressors CDKN2A, RB1, TP53 and VHL were included as positive controls and oncogenes CCND1, ERBB2, MDM2 and MYC as negative controls. Stars indicate genes closely resembling the tumor suppressor signature.

Figure 4. Loss of EPHA3 confers p16INK4A- and p53-dependent senescence. Live cell analysis of (A) EPHA3 plus p16INK4a siRNA-treated and (B) EPHA3 plus p53 siRNA-treated hTERT-RPE1 cells. The average nuclear area off all cells per image is shown. Representative 20x images from each condition are shown in the lower panels.
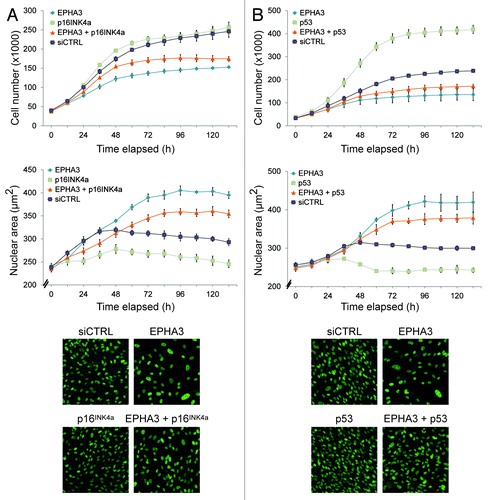
Figure 4. Loss of EPHA3 confers p16INK4A- and p53-dependent senescence. Live cell analysis of (A) EPHA3 plus p16INK4a siRNA-treated and (B) EPHA3 plus p53 siRNA-treated hTERT-RPE1 cells. The average nuclear area off all cells per image is shown. Representative 20x images from each condition are shown in the lower panels.

Figure 5. Selected EPHA3 cancer gene mutations confer decreased kinase function. (A) Schematic representation of EPHA3 protein domains and selected cancer point mutations pertinent to this study. (B) Cellular kinase activities of selected EPHA3 tumor variants. 293T cells expressing EPHA3-LAP variants were treated with preclustered ephrin-A5 and immunoprecipitates were immunoblotted. Anti-GFP was used to detect EPHA3-LAP. Relative cellular kinase activities were determined by normalization of the PY (phosphotyrosine) against the EPHA3 signal, and normalized values relative to WT are shown in arbitrary units. (C) In vitro kinase assays of selected EPHA3 tumor variants. Immunoprecipitates from kinase assays or input lysate samples from 293T EPHA3-LAP lines were immunoblotted with indicated antibodies, and normalized values were calculated as in (B). (D, E and F) Structural analyses of EPHA3 tumor variants R728L and D806N and structural alignment of the EPHA3 and LKB1 kinase domains. PDB structure files were analyzed using the PyMOL molecular visualization package. Notable alterations are encircled. (G) In vitro kinase assay of EPHA3 D806Y variant. 293T cells expressing EPHA3-LAP proteins or control lysate were treated with preclustered ephrin-A5. GFP immunoprecipitates from kinase assays were immunoblotted with the indicated antibodies.
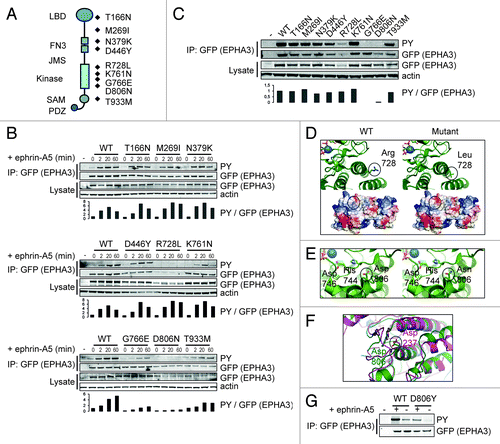
Figure 5. Selected EPHA3 cancer gene mutations confer decreased kinase function. (A) Schematic representation of EPHA3 protein domains and selected cancer point mutations pertinent to this study. (B) Cellular kinase activities of selected EPHA3 tumor variants. 293T cells expressing EPHA3-LAP variants were treated with preclustered ephrin-A5 and immunoprecipitates were immunoblotted. Anti-GFP was used to detect EPHA3-LAP. Relative cellular kinase activities were determined by normalization of the PY (phosphotyrosine) against the EPHA3 signal, and normalized values relative to WT are shown in arbitrary units. (C) In vitro kinase assays of selected EPHA3 tumor variants. Immunoprecipitates from kinase assays or input lysate samples from 293T EPHA3-LAP lines were immunoblotted with indicated antibodies, and normalized values were calculated as in (B). (D, E and F) Structural analyses of EPHA3 tumor variants R728L and D806N and structural alignment of the EPHA3 and LKB1 kinase domains. PDB structure files were analyzed using the PyMOL molecular visualization package. Notable alterations are encircled. (G) In vitro kinase assay of EPHA3 D806Y variant. 293T cells expressing EPHA3-LAP proteins or control lysate were treated with preclustered ephrin-A5. GFP immunoprecipitates from kinase assays were immunoblotted with the indicated antibodies.
Supplemental material

Additional material

Download Zip (2.6 MB)