Figures & data
Figure 1.PANK1 gene is a p53 transcriptional target. (A) Schematic representation of the human PANK1 gene and its promoter. The potential p53 binding sites (p53 BS) are located in the 5′ region of PANK1 exon 1α. TSS represents the transcriptional start site. Luciferase construct pLucA containing the p53 BS and construct pLucB lacking the p53 BS are derived from the potential PANK1 promoter region for luciferase reporter gene assays in (C and D). In addition, luciferase constructs containing mutations of the potential p53 consensus sequences are denoted as pLucA’1, pLucA’23, pLucA’45, and pLucA’2345. (B) The left panel shows ChIP-qPCR analysis of p53 enrichment at the promoter regions of PANK1, TIGAR, SCO2, GLS2, and p21 in H1299 cells expressing p53. GAPDH and a region located 2 kb upstream of the PANK1 p53 BS were used as negative controls. The right panel shows semi-quantitative analysis of p53 binding to the corresponding regions in the left panel. (C) p53 activates luciferase activity of reporter construct containing p53-binding elements in the PANK1 promoter. H1299 cells were transfected with control vector (pCIN4), increasing amounts of p53 expression vector, or vector expressing binding-deficient p53 mutant R175H along with luciferase constructs pLucA or pLucB for 24 h before measuring luciferase activity. (D) Mutations of p53-binding elements on the reporter construct abolished p53-induced luciferase activity. H1299 cells were co-transfected with p53 expression vector and various mutated luciferase constructs for 24 h before measuring luciferase activity. (E) Gel shift assay showing p53 binding on oligonucleotide containing p53-binding sites in the PANK1 promoter region. The DNA binding activity of purified p53 protein was enhanced with C-terminal p53 antibody pAb421. Specificity of the binding was verified by competition with non-radiolabeled wild-type and mutant probes.
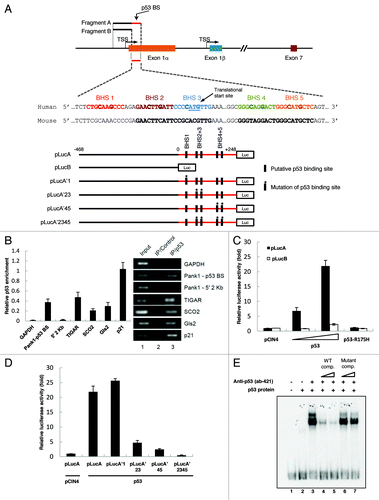
Figure 2. p53 induces PanK1 expression. (A) H1299 cells were transfected with either control or p53-expressing vectors, and mRNA were extracted from cells 24 h after transfection and analyzed via RT-qPCR for PanK1α and p21 expressions. (B) western blot analysis of the protein levels of PanK1α, p21, p53, and actin in H1299 cells transfected with control vector and vectors expressing wild-type and R175H mutant p53. (C) HCT116 p53+/+ and p53−/− cells were treated with 20 μM Etoposide, 10 nM Actinomycin D, and 0.2 μg/mL Doxorubicin for 12 and 24 h, and cell lysates were analyzed by western using PanK1, p53, p21 and actin antibodies. (D) U2OS cells were treated with 20 μM Etoposide and 10 nM Actinomycin D for 8 and 24 h, and mRNA levels of PanK1α and PanK1β were analyzed via RT-qPCR. (E) HCT116 p53+/+ and p53−/− cells were treated with 10 nM Actinomycin D for 12 and 24 h, and mRNA levels of PanK1α and PanK1β were analyzed via RT-qPCR.
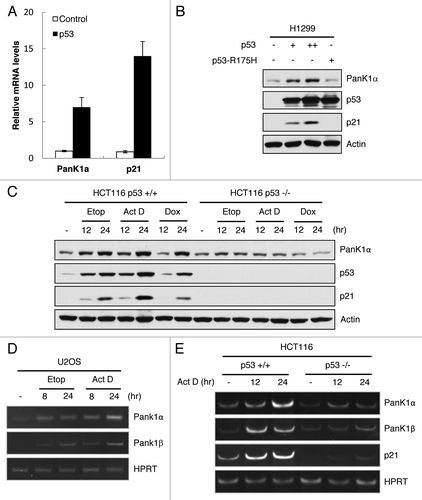
Figure 3. PanK1 is not required for DNA-damage-induced apoptosis. (A) HCT116 p53+/+ and p53−/− cells were transfected with control or PanK1 siRNA for 36 h and were subsequently treated with 10 nM Actinomycin D for 0, 8 or 24 h. Total cell extracts were assayed for PanK1, p53, p21, cleaved PARP, cleaved caspase 3 and actin. (B) HCT116 p53+/+ and p53−/− cells were transfected with control or PanK1 siRNA for 36 h and then treated with 10 nM Actinomycin D for 36 h. The cells were harvested, fixed with ice-cold methanol and analyzed by flow cytometry. Cells with sub-G1 DNA content were scored as apoptotic cells.
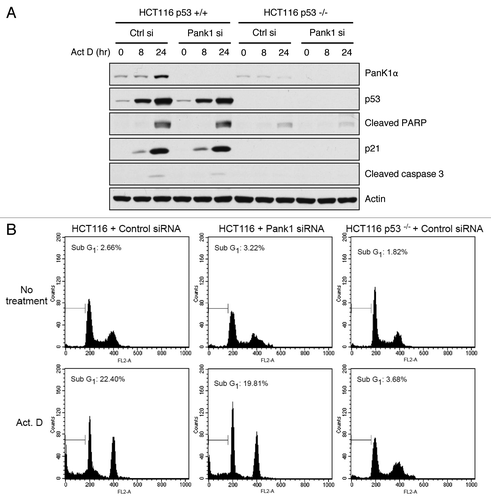
Figure 4. p53 regulates PanK1 expression under starvation and directly regulates PanK1 activity. (A) HCT116 p53+/+ and p53−/− cells were glucose-starved (DMEM + 10% FBS + no glucose) for the times indicated. Total cell extracts were assayed for PanK1, p53, Puma, p21, cleaved caspase 3 and actin. (B) H1299 cells were transfected with p53 or PanK1 (Pank1a)-expressing vectors, and total cell extracts were obtained to assay for PanK kinase activity in vitro.
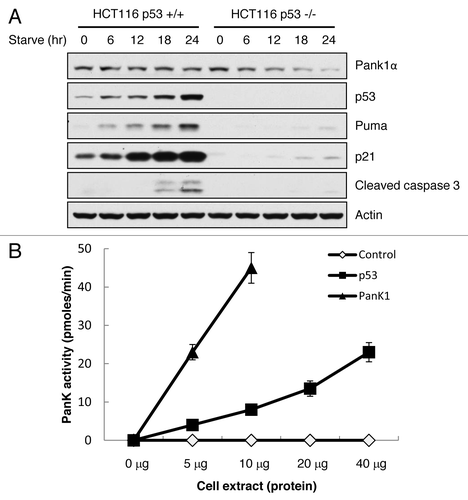
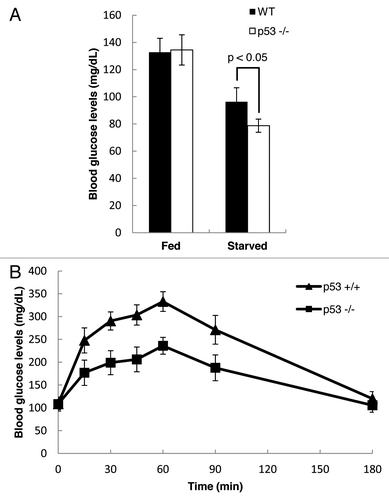
Figure 5. p53 regulates gluconeogenesis in vivo. (A) Blood glucose levels were measured in WT and p53−/− mice that were either fed or starved for 2 d (WT fed, n = 4; WT starved, n = 4; p53−/− fed, n = 6; p53−/− starved, n = 6). (B) Pyruvate challenge test was performed using WT and p53−/− mice that were starved for 16 h (WT mice, n = 5; p53−/− mice, n = 7). Blood glucose levels were measured at different time points after intra-peritoneal injection of sodium pyruvate.